Dax © 23.808 -0,53%
Dow Jones 44.576 -0,54%
S&P 500 6.279 +0,83%
Dow Jones 44.576 -0,54%
S&P 500 6.279 +0,83%
Nasdaq 22.735 -0,54%
Nikkei 39.748 -0,85%
Hang Seng 23.916 -0,64%
Nikkei 39.748 -0,85%
Hang Seng 23.916 -0,64%
EUR/USD 1,18144 +0,23%
BTC/USD 107.557 -1,90%
ETH/USD 2.499 -3,56%
BTC/USD 107.557 -1,90%
ETH/USD 2.499 -3,56%

App installieren
How to install the app on iOS
Follow along with the video below to see how to install our site as a web app on your home screen.
Anmerkung: This feature may not be available in some browsers.
Du verwendest einen veralteten Browser. Es ist möglich, dass diese oder andere Websites nicht korrekt angezeigt werden.
Du solltest ein Upgrade durchführen oder einen alternativen Browser verwenden.
Du solltest ein Upgrade durchführen oder einen alternativen Browser verwenden.
Rohstoffthread (Archiv)
- Ersteller Maack
- Erstellt am
- Tagged users Kein(e)
- Status
- Für weitere Antworten geschlossen.
Moin spider
Schau Dir das Sentiment an. Das Explorerumfeld leidet meiner Meinung nach stark am Risikokapitalabzug und der dadurch hervorgerufenen Unsicherheit im Explorermarkt. Cuervo fehlt die Resourcenverifizierung, die nun diese Woche endlich kommen sollte mit dem ersten NI 43-101 konformen Report.
Dieser sollte die bis dato angehäufte Phantasie für den Wert nun erstmals untermauern.
Die Kurse der Explorer sind auf breiter Ebene abverkauft worden und werden es immernoch. Die Situation im Markt spielt wie duke es schon anmerkte Leerverkäufern natürlich noch zusätzlich in die Hände. Kommen dann noch explorertypische Verzögerungen bei NI Berichten, Results oder Studien hinzu verstärkt sich der Druck in den Kursen weiter.
Cuervo Resources hat langfristig weiterhin sehr gute Chancen! Die Entwicklung verläuft aussichtsreich und der kommende Newsflow sollte dies untermauern. Kurzfristig ist aber im Sektor noch zuviel Unsicherheit um an nachhaltige Kursschübe nach oben zu denken. Da empfiehlt sich eher reines Newstrading oder eben der Aufbau von Tradingpositionen neben der Longposition.
Also nicht unterkriegen lassen!
[url=http://peketec.de/trading/viewtopic.php?p=450565#450565 schrieb:spider schrieb am 27.07.2008, 22:33 Uhr[/url]"]Hört sich gut an, aber der Chart sieht fürchterlich aus. Was stimmt nicht ? Trader ? Shorties?
Kann doch nicht sein, oderDie Aktie findet keinen Boden

[url=http://peketec.de/trading/viewtopic.php?p=450549#450549 schrieb:Ollinho schrieb am 27.07.2008, 15:55 Uhr[/url]"]Aktuelle Information zur Entwicklung und kommenden Newsflow bei -CRR- Cuervo Resources!
Habe kürzlich umgehend Antwort auf einen recht ausführlichen Fragekatalog von Tom Berner
(IR-Abteilung) erhalten:
By the end of July, Cuervo will publish it's NI 43-101 Resource Report.
The Huillque zone is being drilled now, and results will be released
throughout August-September.
The road to the Aurora Zone will be finished shortly, and a drill will
commence in August, with results by September-October.
A geophysical survey on the complete Cerro Ccopane property is presently
being done, with results expected by October, which will identify more
mineral zones for drilling.
A metallurigical study will be published in November-December, which will
clarify the iron ore processing methods and costs.
A transportation study will be published in December-January, which will
clarify transport methods and costs.
I hope this answers your questions.
Cuervo Resources Inc.
Tom Berner
Investor Relations
1-416-203-3957 ext. 202
investors@cuervoresources.com
")
[url=http://peketec.de/trading/viewtopic.php?p=450635#450635 schrieb:dukezero schrieb am 28.07.2008, 08:58 Uhr[/url]"]übrigens für die Info!
Denke das sollte selbstverständlich für unseren "Geröllbudenthread" hier sein!
Newsflow sollte also diese Woche starten
http://www.kitco.com/ind/balarie/jul252008.html
Emanuel Balarie
Jul 25 2008
I recently returned back from China with some pertinent observations about the commodity markets, Jim Rogers, and the economy. A couple of weeks ago, I mentioned in mycommodities newsletter that if anyone had doubts about the long-term direction of the commodity markets, they should simply hop on a plane and fly to China. The logic behind this is quite simple. Since China has been responsible for the majority of the increased commodity demand over the last decade, keeping a pulse on their commodity consumption trends can give you a pretty clear picture of where things are moving in the longer term. Here are some observations on various topics:
Chinese Commodity Demand
It is important to note that there are two components to the Chinese commodity demand. The first component is the demand for commodities as a result of industrialization and foreign investments. The second component is a result of consumer demand. I will talk more about consumer demand in China next week in my free newsletter.
When China began its transition from an agrarian based economy to a manufacturing driven economy, there was a huge influx of demand for metals, energy, cement, and other industrial materials. This demand came from both foreign investors who were interested in building manufacturing plants to profit from the cheap labor, as well as from governmental mandates that focused on economic and infrastructure development.
If you fly to China today, you will see state- of -the art buildings, manufacturing plants, roads, and rail systems. Since all of this was only developed over the past decade, it is easy to understand why China transitioned from being a net exporter of commodities to becoming one of the world’s largest importers of commodities.
One can get a much better understanding of this increased commodity-demand trend by observing the development of the transportation system in China.
In Shanghai for instance, you can jump on the world’s first Maglev train that will take you from the airport to downtown Pudong/Shanghai in record time. Since the train travels at about 430 km/hour, the typical 45 min trip (via car) will only take you about 8 minutes. If you decide to take the toll roads instead, you will also notice a very new and elaborate highway system that is still in the process of being built nationally.
In 2005, the Chinese government put in place a “National Expressway Network Plan” which is supposed to connect all capitals of provinces and autonomous regions with Beijing and other cities. According to government reports, the length of highways is expected to total 85,000 km and take another 25 years to complete. As you can imagine, building roads will not only continue the demand for certain raw materials like cement and energy, but it will also expand industrialization. The UN still expects that there will be about 400 million Chinese farmers that will move into the cities within the next decade. A number of these farmers are still living in the provinces that have not yet been impacted by the massive industrialization.
What is interesting about the transportation development in China is that it was initiated prior to this bull market in commodities, and before the country experienced 10% yearly economic growth. The Maglev train, for example, was first commissioned to be built in 2000-2001. Clearly, the Chinese government looked at the longer term prospects for its economy when it decided to invest the capital into building the train. Today, it is also clear that that this forward-thinking evaluation was spot on.
In the same way, China is thinking ahead in terms of commodity demand. While an economic slowdown in western economies might have a short-term affect on the Chinese economy, the longer-term prospects of growth in China remain strong. As a result, China is not shying away from commodity consumption any time soon. They still have roads to pave, factories to build, and cities to expand.
I wrote a couple weeks ago that another sign that this commodity bull market is far from over, was the fact that China, India, and Japan were investing heavily in Africa- a commodity-rich continent. Their initial investments are paving the way for future resource extraction. Clearly, there is a longer-term commodity demand.
Jim Rogers & Airlines
For many Jim Rogers fans, it is comforting to know that he has not jumped off the commodity bull market bandwagon. Rogers recently stated that investors should avoid the dollar and buy commodities. In fact, he believes that commodities will be one of the better investments this year.
When I was in China, I had an opportunity to listen to a Jim Rogers interview that was conducted on a local television network. During his interview, he mentioned that he was bullish on airline companies. At first, I was taken aback by his bullish tone in the midst of rising fuel prices, a slowing global economy, and airline bankruptcy. However, there is some validity to his point over the longer-term. While Jim Rogers himself admits that he is not a short-term trader, he has been fairly accurate on longer-term themes. I still think it’s too early to invest in Airlines, but it could indeed be a value investment play.
Having flown frequently over the past several years, I have noticed that the amount of people who are flying has not declined. In fact, I am actually noticing fuller planes. In the past, you might see empty seats around you. Today, the planes are jammed packed. One of the reasons has to do with the fact that there are fewer flights available in the midst of similar demand. As a result, airline companies are increasing their fares and baggage fees- and the passengers are still willing to pay the higher cost.
International vs. Domestic Travel
When I was flying to and from China, I also noticed that greater than ¾ of the passengers were Asian or Indian. This number is significantly higher than it was several years ago. In fact, I believe that with the declining dollar and rising wealth in emerging economies, you will begin to see a great increase in passengers coming to the US.
This assertion is backed by some recent data from the US Department of Transportation. According to the Bureau of Transportation Statistics, domestic air travel was down 0.3 percent from 214.4 million passengers carried in the same period in 2007. International travel, however, experienced a gain of 5.4 percent from the 28.8 million carried during the same period in 2007.
In terms of available seats in April, domestic travel experienced a 1.8% decline and international travel experienced a 6.3% increase. Clive Maund also writes about this topic in his recent commentary.
In short, the above airline trends and statistics reaffirm what I have been saying for the last several years- the consumer demand from industrializing economies will more than make up for the slowdown of the US consumer.
Boring- But True
During my trip, I also had an opportunity to speak to several high level executives of a global investment company. After I finished talking about the global demand and supply factors that would commodity prices higher, they asked me a question that shocked me. In short, they wanted to know some “other factors” for rising commodity prices. They already knew the basic supply/demand story for rising commodity prices, but it seemed that the story was getting quite old and boring. They wanted to hear something different and exciting.
Unfortunately for them, the reasons for why oil is eventually going to be above $200/barrel, why gold prices will reach over $2000/ounce, and why the commodity bull market has at least another 5 years of upward movement remain the same. There is no new exciting development to report. And if investors have not quite yet grasped the magnitude of this commodity bull market, they probably never will. As for me, I continue my longer-term view of higher commodity highs.
July 25, 2008
Iron ore price negotiations - NMDC seeking 97% hike
BS reported that India largest iron ore producer NMDC is seeking up to 97% increase in iron ore prices from foreign steel makers.
Ahead of an Indian delegation's visit to Japan and Korea to settle long term contract prices with the steel mills there, NMDC has informed Steel ministry seeking nearly 80% increase in prices of iron ore fines and over 96% on lumps from the international clients.
As per the report, this is significant for steel industry here as domestic iron ore prices are determined on the basis of the percentage increase accepted by Japanese steel mills for NMDC's products duly adjusted to rupee to dollar parity.
Industry official said that "If iron ore prices shoot up by 100% it will substantially add to our input costs which may ultimately have a reflection on steel prices."
Of its total 30 million tonnes annual production, NMDC exports around 3.5 million tonnes to Japanese steel mills and South Korea's steel giant POSCO under long term contracts.
Other than sponge iron makers, steel players like Essar, Ispat and RINL have long term contracts with NMDC for iron ore supply.
http://www.321gold.com/editorials/casey/casey072508.html
Casey Files:
Where Is the Economy Going
in the Next 6 Months?
Bud Conrad
Chief Economist
The Casey Report
Jul 25, 2008
As investors, the question we have to focus most of our attention on just now is what impact the credit crisis, the bursting housing bubble and the actions of the U.S. government will have on the economy and investment markets in the next six months.
We have seen the Fed and the federal government move to panic mode as they try to keep the system afloat. As expected, they have cut rates, as well as having given away checks and rearranged the Federal Reserve's entire balance sheet.
The underlying problems have not been fixed with this massive bailout. There are still many credit pot holes out there and new lending remains highly constrained. Even the government tax rebate checks, rather than boosting the domestic economy, were largely absorbed by higher oil prices. The resulting cut-back in consumer spending, coupled with ongoing constrictions in lending, will cause a severe slowing of the economy.
But the much bigger implication is that the Fed is busy pouring more gasoline on the fire by fighting the collapsing housing bubble, a housing bubble created by excess liquidity, with yet more liquidity. That is the key point that should be taken from this mess. The dollar is now firmly on an even steeper slope to its ultimate demise. Other currencies will be sliding down the same slope, so another paper currency is not the answer.
This, then, is a high-level context for many of our investment recommendations in the months ahead.
Short Term Projections
1. The housing decline is not yet done, because we will need another year to unwind foreclosures in the pipeline. In addition, the exuberance shown by appraisers at the height of the housing bubble still has a long ways to go to fully deflate. What is that house on the market down the road really worth? At this point, no one knows... and no one will know until it and many others are bought by willing buyers (as opposed to unwilling lenders taking them onto their books in a foreclosure).
2. Consumers in the U.S. are not able to expand credit and are increasingly concerned about the outlook for the economy, so they will slow spending both at home and on imports.
3. The financial/banking system is weaker than understood. The complexity of the global system and the ubiquitous presence of interlocking financial and credit instruments and literally trillions of dollars in derivatives has left the world's banks teetering on the edge.
Adding a push from behind, we have broadly rising inflation and soon the persistently higher interest rates that are the bane of fixed-income investors and financial institutions in general. As the dollar continues its fall, and the banks continue to come under pressure, the lack of confidence in these keystones of the modern financial system will deepen. Already, the Sovereign Wealth Funds that rushed in early in the credit crisis to prop up the big investment houses are now signaling that, at least for the time being, they are going to step back and watch how things shake out.
4. A slowing economy - recession - coupled with inflation, creates a condition often referred to as stagflation, presenting much bigger policy challenges for the government than one or the other alone.
5. The food crisis. Shortages of food production come from rising energy and fertilizer costs. Rising demand comes from a shift in diet, especially in emerging markets, where increasing prosperity leads the citizenry to add more protein to their diets. Important shortages in grains have arisen that don't allow for a bad crop year. Most concerning is that these shortages are occurring despite good crop production last year, an occurrence that can be blamed, in part, on the diversion of some agriculture production for ethanol and bio-diesel.
These food shortages have already contributed to a doubling and tripling in the price of grains over the last two years. But even these elevated prices have not been sufficient to offset the higher costs of the energy required to produce the crops. And, despite today's higher prices, agriculture still lags the price increases seen in many other commodities.
[For more information on the subject of food, watch my recent appearance on FOX Business News here.]
The result of this is that the inflation rate, interest rate, food, energy and precious metals are heading higher as the dollar is debased.
Higher rates are not good for housing and stocks. In the long term, they will recover in nominal terms, though not in actual terms. That's because, while their nominal prices may return to current or near current levels, the dollars used to express their value will have much reduced purchasing power... making those assets a mediocre investment for the foreseeable future.
Finally, it is important to recognize that the world remains in the throes of a deep and serious crisis. While many analysts will express the view that the worst is over or that, after a modest downturn, things will bounce back just like they always have, our view is that what we will actually witness going forward is a fairly steady occurrence of crisis and panic. The crisis will accelerate, moving faster, even, than in previous major shifts such as that witnessed in the 1970s.
While history may find we are too pessimistic at this point in time, in our view it is far better to prepare for a worsening crisis and hope that it does not materialize, than to expect business as usual.
Bud Conrad is the Chief Economist of Casey Research, LLC., publishers of Doug Casey's International Speculator which provides unbiased research and recommendations on the highest quality junior exploration companies.
.
.
http://money.cnn.com/news/newsfeeds/articles/apwire/673cf352…
Proposed $8 billion coal buyout gets rocky
Cleveland-Cliffs' biggest shareholder tries to put brakes on $8 billion buyout of Alpha
July 25, 2008: 04:58 PM EST
NEW YORK (Associated Press) - Cleveland-Cliffs' largest shareholder may attempt to scuttle a proposed $8 billion buyout of coal company Alpha Natural Resources Inc.
Hedge fund Harbinger Capital Partners owns 18.4 percent of the iron ore producer's stock, giving it enough weight to put any deal in jeopardy.
In a regulatory filing that followed the announced buyout last week, Phil Falcone's Harbinger Capital said the proposal was not in the best interests of shareholders.
The Wall Street Journal reported that Falcone is pushing for the sale of Cleveland-Cliffs Inc. An unidentified person familiar with Falcone's views told the Journal that Falcone believes commodity prices are nearing their peak and with global steel companies searching for fuel to feed their mills, now is the optimum time to sell.
Cleveland-Cliffs needs affirmative votes from the holders of two-thirds of all shares for the deal to go forward under Ohio law.
Company spokesman Steve Baisden said Friday that the deal for Alpha is in the best interests of Cleveland-Cliffs shareholders and that management would continue to meet with shareholders to discuss the proposal. He said the company has not heard directly from Harbinger.
Cleveland-Cliffs shares rose 5.4 percent, or $5.01, to $98.01 in trading Friday. Alpha shares also rose 5.4 percent, or $4.55, to $88.45.
The Cleveland-based company announced its bid for Alpha on July 16 in which Abingdon, Va.-based Alpha shareholders would receive 0.95 Cleveland-Cliffs shares and $22.23 in cash for each share. The companies pegged the deal at $10 billion the day it was announced. Based on the company's 70.3 million outstanding shares at April 23, the deal is valued at $8 billion currently.
The attempted buyout comes amid a global consolidation of the commodities industry that has begun to accelerate, with major acquisitions by Luxembourg-based ArcelorMittal, the world's largest steelmaker, and Korean steel giant Posco.
The price of the U.S. coal used to make the coke that fuels the blast furnaces can go for as much as $250 a ton. Just last year, the cost was closer to $90.
The combined company would be named Cliffs Natural Resources, and own nine iron ore facilities and more than 60 coal mines in North and South America and Australia.
Boom bei Eisenerz bleibt ungebrochen
Stuttgart (www.rohstoffe-go.de) Die Preiswelle bei Eisenerz aufgrund der weltweit anhaltend hohen Nachfrage nach Stahl setzte sich auch im Jahr 2008 fort. Es kam sogar zu einer Preisbeschleunigung, wie das Researchhaus Raw Materials Group in seinem Report „Iron Ore Market 2007-2009“ jüngst publizierte.
Mit Preisanstiegen von 65-97% kam es zu den bisher höchsten Zuwachsraten bei Eisenerz. Die weltweite Produktion des gesuchten Rohstoffs stieg im Jahr 2007 um 9% gegenüber dem Vorjahr. 2006 betrug der Anstieg 11%. Das meiste Eisenerz wird in Brasilien produziert, gefolgt von China, welches die Minenproduktion unerwartet stark um 20% steigern konnte.
In dem Report wird weiter berichtet, dass die weltweite Nachfragesituation nach Eisenerz wohl noch bis zum Jahr 2010 oder sogar 2011 angespannt bleiben wird. Dies dürfte auch weitere Preissteigerungen zur Folge haben.
The Northern Miner, Monday, July 28, 2008
Iron ore market to stay strong in 2009: forecasts
By Ron Mandel
The iron ore boom continues, with the market expected to stay firm through next year, according to a report by the Iron Ore Trust Fund of Geneva-based United Nations Conference on Trade and Development (UNCTAD).
Published in June in co-operation with Stockholm-based Raw Materials Group, The Iron Ore Market 2007-2009 reports that price increases agreed to so far this year vary from 65-97% -- the highest ever.
Iron ore prices are soaring because demand has grown faster than expected, says the Iron Ore Trust Fund, while growth in production has been delayed by a lack of infrastructure, equipment delivery delays, and a shortage of skilled labour. Putting further pressure on prices is the small number of major iron ore producers, which are at an advantage when negotiating with the fragmented steel industry.
The three largest iron ore companies, Vale, Rio Tinto and BHP Billiton, together control 35% of the market. Should BHP succeed in its takeover bid for Rio Tinto -- formally announced in February -- it would lead to further industry concentration.
The concentration in seaborne iron ore is even higher: Vale alone controls 36% of the total world market for seaborne iron ore, and the three largest companies control 69%.
Moreover, iron ore producers are aware that steel producers have raised prices and therefore can handle higher raw material costs, the report notes.
BHP recently announced an agreement to sell fine iron ore to China's Baosteel at about US$145 per tonne, up 80%, and lump iron ore at about US$202 per tonne, up 97%.
This year, the Chinese lost the lead in iron ore price negotiations as Vale signed the first agreement for 2008 with Nippon Steel and Korean company POSCO.
In order to limit the pricing power of iron ore producers, steel producers are creating a network of captive coal and iron ore mines, or building holdings in these mining sectors. For example, ArcelorMittal, the world's largest steel company, recently announced it was buying small U. S. miner Mid Vol Coal Group.
World use of finished steel products increased by 6.6% in 2007 to 1.2 billion tonnes, while world crude steel production increased by 7.5% to 1.34 billion tonnes. Growth continues at a high rate into 2008. Steel demand in China grew by 13% in 2007, and, remarkably, by almost the same percentage in the Middle East.
Steel production in China increased by 16%, and it now accounts for a little more than a third of world production. China, which became a net steel exporter only in 2005, accounted for 21% of world steel exports in 2007.
World production of iron ore grew by 9% in 2007 (compared with 12% in 2006) to 1.6 billion tonnes. Output increased mainly in the four major producing countries: Brazil, China, Australia and India. Mine production in China grew at a faster-than- expected 20%. With a production rate of 332 million tonnes of iron ore -- 20% of world production -- China strengthened its position as the world's second largest producer, just behind Brazil and well ahead of Australia.
World iron ore exports increased by 8.1% (compared with 6.1% in 2006) to 822 million tonnes. Brazil is now the leading exporter at 269 million tonnes, overtaking Australia. Indian exports grew for the seventh consecutive year, and at 94 million tonnes, the country is the third most important exporter, well ahead of South Africa, Canada and Russia, each with exports in the 25-to 30-million-tonne range. China, which imported 383 million tonnes of iron ore in 2007, or 46% of world iron ore imports, continues to be the most important importing country, followed by Japan, Germany and Korea. Europe, excluding the Commonwealth of Independent States, accounts for 21% of world imports.
Seaborne iron ore trade has increased by 9% to 799 million tonnes. World production of pellets reached 326 million tonnes, up 1.5%. World exports of pellets were 137 million tonnes, an increase of 3.9%. The share of pellets in total iron production fell sharply to 20% in 2007, but there are signs that will rise.
Nearly 130 million tonnes of new iron ore mining capacity was brought into production in 2007, considerably more than in 2006. The focus for new developments is changing to Brazil and West Africa from Australia. In total, more than 600 million tonnes of new capa- city is planned to come on-stream between 2008 and 2010, compared to demand growth of 340 million tonnes over the same three-year period, based on projections by the International Iron and Steel Institute. However, of the 600 million tonnes, around 336 million tonnes are in the certain category, with 77-167 million tonnes in the probable category, and 196 million tonnes in the possible category.
So it would appear that the projects in the certain category would satisfy the demand growth completely, while any further projects would create an over-supply in 2010 or 2011 at the latest. This outcome is far from certain because of the many obstacles and bottlenecks standing in the way of new projects. However, in view of the size of the potential surplus, an over-supply could happen, especially if demand is lower than anticipated. The outcome depends heavily on the ability of Chinese producers to expand production. If freight rates remain high, these producers will continue to enjoy a competitive advantage.
UNCTAD concludes that the iron ore market will most likely continue to be tight until 2010, or perhaps even 2011. There are several indications that prices will increase further in 2009 but the outcome for the following years is more uncertain. At the same time, it appears likely that trade in iron ore will become more diverse, with shorter-term arrangements and flexible pricing systems playing a larger role and the decline of the benchmark negotiating system.
In a research note from late June, Citigroup analyst Alexander Hacking said that China is attempting to de-stock iron ore, causing spot prices to decline to US$185 per tonne from US$205. Meanwhile, demand from Chinese pig iron production has risen by 9% since January. Citigroup believes that in the short term, Chinese de-stocking will continue, resulting in reduced imports and continued spot price weakness.
However, in the long-term, high-quality iron ore remains undersupplied. Supply disruptions have more than offset softer consumption in 2008, and Hacking forecasts that strong Chinese demand, coupled with continued supply issues, will produce another tight market in 2009. The research note says that India has introduced a 15% export duty on iron ore, a symptom of supply problems.
For 2010, Citigroup forecasts Asia prices for iron ore at US$262 per tonne for lump iron ore (Brockman) and US$188 for fine iron ore (Yandi or Brockman).
Long-term projections are US$115 per tonne for lump iron ore (Brock- man), US$90 for fine iron ore (Brockman), and about US$85 for fine iron ore (Yandi).
Deutche Bank, in its Commodities Quarterly in late June, projected that the iron ore market will remain tight until 2011, when it will swing into surplus. The bank forecasts Australian export lump iron ore will reach about US$206 per tonne in 2009, gradually declining to about US$82 in 2013. Australian export fine iron ore is projected to reach about US$162 per tonne in 2009, declining to US$64 by 2013.
Mal nach vorne holen! 
")
[url=http://peketec.de/trading/viewtopic.php?p=450549#450549 schrieb:Ollinho schrieb am 27.07.2008, 15:55 Uhr[/url]"]Aktuelle Information zur Entwicklung und kommenden Newsflow bei -CRR- Cuervo Resources!
Habe kürzlich umgehend Antwort auf einen recht ausführlichen Fragekatalog von Tom Berner
(IR-Abteilung) erhalten:
By the end of July, Cuervo will publish it's NI 43-101 Resource Report.
The Huillque zone is being drilled now, and results will be released
throughout August-September.
The road to the Aurora Zone will be finished shortly, and a drill will
commence in August, with results by September-October.
A geophysical survey on the complete Cerro Ccopane property is presently
being done, with results expected by October, which will identify more
mineral zones for drilling.
A metallurigical study will be published in November-December, which will
clarify the iron ore processing methods and costs.
A transportation study will be published in December-January, which will
clarify transport methods and costs.
I hope this answers your questions.
Cuervo Resources Inc.
Tom Berner
Investor Relations
1-416-203-3957 ext. 202
investors@cuervoresources.com
wenn ihr jetzt immer mal merkwuerdige Mini-Posis bei sub-10mio CAD MK Buden seht, das sind haeufig meine, sowohlhier als auch drueben an der TSX, ich streu jetzt breit bei den ganzen gefallenen Werten mit teils gerade mal 100 Euro Einsatz, Schnitt so um die 300 Euro, immer so 20-25 Stueck im Monat, die Werte haben sich teils gezehntelt bis gezwanzigstelt, kann mir nicht vorstellen, dass die alle pleite gehen
u.a.
Pershimco
Dajin
Cooper Minerals
Serengeti
Trigon
Takara
Latin American
und und und
die Basketwerte kaufe ich ebenfalls fast alle nach, nur nicht Vangold, solange da dasselbe Management im Boot ist!
u.a.
Pershimco
Dajin
Cooper Minerals
Serengeti
Trigon
Takara
Latin American
und und und
die Basketwerte kaufe ich ebenfalls fast alle nach, nur nicht Vangold, solange da dasselbe Management im Boot ist!
einer meiner Top-Favouriten auf 12-Monatssicht
Emed Mining
mit 3 weiteren Buy-Empfehlungen von guten Haeusern
http://emed-mining.com/site/dmdocuments/EMED_Mining_Fox_Davies_Flash_Note_9July2008.pdf
http://emed-mining.com/site/dmdocuments/EMED_Mining_Edison_Research_July08.pdf
http://emed-mining.com/site/dmdocuments/EMED_Mining_Hardman_Research_Note_11July2008.pdf
Stuttgart Die Preiswelle bei Eisenerz aufgrund der weltweit anhaltend hohen Nachfrage nach Stahl setzte sich auch im Jahr 2008 fort. Es kam sogar zu einer Preisbeschleunigung, wie das Researchhaus Raw Materials Group in seinem Report "Iron Ore Market 2007-2009" jüngst publizierte.
Mit Preisanstiegen von 65-97% kam es zu den bisher höchsten Zuwachsraten bei Eisenerz. Die weltweite Produktion des gesuchten Rohstoffs stieg im Jahr 2007 um 9% gegenüber dem Vorjahr. 2006 betrug der Anstieg 11%. Das meiste Eisenerz wird in Brasilien produziert, gefolgt von China, welches die Minenproduktion unerwartet stark um 20% steigern konnte.
In dem Report wird weiter berichtet, dass die weltweite Nachfragesituation nach Eisenerz wohl noch bis zum Jahr 2010 oder sogar 2011 angespannt bleiben wird. Dies dürfte auch weitere Preissteigerungen zur Folge haben.
Werner W. Rehmet - Rohstoffe-Go.de
July 28, 2008
Aquila Intersects Copper and Gold Rich South Limb Massive Sulfide
Including 4.3 meters of 26.1 grams per tonne gold and 366 grams per tonne silver
TORONTO, ONTARIO--(Marketwire - July 28, 2008) - AQUILA RESOURCES INC. (TSX:AQA)(FRANKFURT:JM4A) ("Aquila" or the "Company") released results from an additional 10 step out and infill drill holes targeting the South Limb Massive Sulfide at the Back Forty Project in Michigan's Upper Peninsula. In addition to intercepts of the South Limb Massive Sulfide, mineralization was encountered above and below the South Limb target, representing unknown or new zones of mineralization. These drill hole results are part of an additional 170 holes drilled in the past year that will be incorporated in an updated National Instrument (NI) 43-101 resource expected later this summer.
Highlights include:
South Limb Massive Sulfide
- 6.2 meters of 2.3% copper and 0.9% zinc in LK-295
- 4.3 meters of 26.1 grams per tonne (g/t) gold and 366.0 g/t silver in LK-307
- 7.2 meters of 7.1 g/t gold and 63.8 g/t silver in LK-309
- 5.4 meters of 10.1% zinc and 0.24% copper in LK-291
- 5.0 meters of 1.0% copper and 1.7% zinc in LK-292
----------------------------------------------------------------------------
All Intervals
in Meters Est.
---------------------- True g/t g/t % % % Descrip- Zone
Hole # From To Width Au Ag Cu Pb Zn tion (ii)
----------------------------------------------------------------------------
Altered
rhyolite
LK-248 21.5 24.5 3.0(i) 2.33 39.85 0.01 0.05 0.04 tuff NS
Altered
rhyolite
38.0 41.0 3.0(i) 3.46 28.03 0.01 0.01 0.06 tuff NS
----------------------------------------------------------------------------
Stringer Un-
LK-287 407.0 411.1 4.1(i) 0.15 7.71 0.03 0.41 2.02 sulfides known
----------------------------------------------------------------------------
Semi-
massive Un-
LK-291 318.7 320.5 1.8(i) 1.27 185.13 0.30 3.02 6.56 sulfide known
S. Limb
massive South
401.5 409.2 5.4 1.42 14.18 0.24 0.17 10.06 sulfide Limb
Massive Un-
432.3 437.1 4.8(i) 1.26 16.09 0.55 0.17 0.13 sulfide known
Felsic
462.5 463.5 1.0(i) 6.96 49.00 0.20 0.45 0.02 dike PM?
----------------------------------------------------------------------------
S. Limb
massive South
LK-292 371.0 398.2 22.7 0.79 17.11 0.50 0.17 0.69 sulfide Limb
S. Limb
massive South
Including 381.5 387.5 5.0 1.05 32.95 0.98 0.16 1.70 sulfide Limb
----------------------------------------------------------------------------
Altered
rhyolite Un-
LK-295 4.5 9.2 4.7(i) 0.14 4.06 0.86 0.05 0.01 tuff known
Semi-
massive Un-
341.9 343.4 1.5(i) 0.72 2.26 0.37 0.34 8.62 sulfide known
S. Limb
massive South
387.6 404.4 15.2 0.92 27.07 1.10 0.25 0.54 sulfide Limb
S. Limb
massive South
Including 397.5 404.4 6.2 1.14 37.14 2.25 0.45 0.94 sulfide Limb
Altered
rhyolite Un-
415.0 418.5 3.5(i) 0.36 6.92 0.90 0.02 0.14 tuff known
----------------------------------------------------------------------------
Semi-
massive Un-
LK-301 394.9 395.9 0.9(i) 0.05 0.50 0.01 0.08 3.16 sulfide known
Altered
rhyolite Un-
445.5 447.2 1.7(i) 0.06 15.04 0.10 0.36 3.73 tuff known
----------------------------------------------------------------------------
Altered
rhyolite
LK-307 77.5 97.0 19.5(i) 1.65 14.17 0.06 0.22 0.88 tuff NS
Altered
rhyolite
Including 85.0 88.0 3.0(i) 3.23 9.55 0.09 0.20 0.24 tuff NS
Altered
rhyolite Un-
168.5 172.8 4.3(i) 26.14 366.03 0.19 2.12 0.87 tuff known
Altered
rhyolite Un-
Including 168.5 171.5 3.0(i) 36.22 480.42 0.25 2.82 1.09 tuff known
S. Limb
semi-
massive South
172.8 185.6 10.6 1.08 28.92 0.06 0.22 2.24 sulfide Limb
S. Limb
semi-
massive South
Including 175.8 182.8 5.8 1.28 35.30 0.05 0.30 3.45 sulfide Limb
----------------------------------------------------------------------------
LK-308 No significant values
----------------------------------------------------------------------------
S. Limb
massive South
LK-309 192.3 200.8 7.2 7.12 63.80 0.17 0.46 0.24 sulfide Limb
S. Limb
semi-
massive South
211.3 215.9 3.5 6.01 173.80 0.35 1.67 0.54 sulfide Limb
----------------------------------------------------------------------------
RS-3 No significant values
----------------------------------------------------------------------------
(i)Drilled thickness, true thickness unknown
(ii)PM equals Porphyry Margin Gold Zone, NS equals NS Gold Zone, South Limb
equals South Limb Massive Sulfide
Holes listed above include a 125 meter down dip step out of the South Limb in LK-291, as well as a 30 meter up-dip step out in LK-307. The holes also included intercepts of the NS Gold Zone, the PM Gold Zone, as well as other peripheral zones of precious metal and zinc mineralization.
As of March 2007 the South Limb and Hinge massive sulfides had a measured and indicated resource of 4 million tonnes grading 1.83 g/t gold, 18.59 g/t silver, 6.58% zinc, 0.25% copper, and these intercepts represent an important extension of those zones.
Drilling at the Back Forty Project currently consists of one drill rig focusing on the Deep Zone massive sulfide, and assay results from several holes targeting the East Zone massive sulfide, near surface definition of the Porphyry Margin Gold Zone, as well as strike extensions of the Pinwheel Zone are still pending.
Although the resource remains open to expansion and numerous other targets remain to be tested, the Company is temporarily slowing down its drill program at the Back Forty Project in order to focus on establishing a new NI 43-101 compliant mineral resource to form the basis for mine planning and scoping work required for a preliminary economic assessment. "We feel that our drilling over the past year and a half has resulted in significant expansion of the March 2007 resource zones, as well as definition of previously undefined gold zones, and that it is important to quantify these expansions and incorporate them into an economic framework," stated Tom Quigley, Aquila's President. Work continues to advance the updated 43-101 compliant resource estimate expected later this summer, and initial engineering studies related to mine planning and plant design have been implemented.
Further information about Aquila and the Back Forty Project including a map showing the location of the holes in this press release as well as the principle mineralized zones is available on the Company's website at www.aquilaresources.com.
Sample preparation and analyses for this release were conducted by Accurassay Labs in Thunder Bay, Ontario on split drill core supplied by Aquila. Standards were inserted in the sample sequences with check assays and re-run's routinely conducted. Tom Quigley, P.Geo. and President of Aquila is the Qualified Person as described in National Instrument 43-101 for the Back Forty Project and is responsible for the content of this press release.
Certain information regarding the Company contained herein may constitute forward-looking statements under applicable securities laws. Such statements are subject to known or unknown risks and uncertainties that may cause actual results to differ materially from those anticipated or implied in the forward-looking statements. The securities being offered have not and will not be registered in the United States under the United States Securities Act of 1933, as amended (the "1933 Act") or any state securities laws, and may not be offered or sold within the United States or to or for the account of benefit of U.S. persons absent U.S. registration or an applicable exemption from U.S. registration requirements. This news release does not constitute an offer to sell or a solicitation of an offer to purchase securities in the United States.
Shares Outstanding: 70,109,478
East Asia Minerals Encounters 27 Metres of 4.35 g/t Gold in Miwah Trench
EAST ASIA MINERALS CORP EAS
7/28/2008 8:00:52 AM
VANCOUVER, BRITISH COLUMBIA, Jul 28, 2008 (Marketwire via COMTEX News Network) --
East Asia Minerals Corporation (TSX VENTURE:EAS) continues to encounter significant gold intercepts from trench sampling at its Miwah Project located in Aceh Province, North Sumatra, Indonesia. These results, including 27 metres of 4.35 g/t gold are from the diatreme breccia target in the western part of the property.
Miwah Trenching Update
Additional encouraging assay results have been received from channel sampling in trenches at the Miwah gold-copper Project in the same area as previously reported (see Table below). Wide intercepts of gold mineralization to over 100 metres are hosted in advanced argillic altered felsic tuff and hydrothermal breccias in an expanded area, now measuring 250 metres by 250 metres (view map at www.EAminerals.com). This mineralization occurs within the historical known high sulphidation alteration footprint of greater than 1000 by 1000 metres.
---------------------------------------------------------
Reference Length (metres) Gold (g/t) Silver (g/t)
---------------------------------------------------------
Trench 16 27.0 4.35 3.21
---------------------------------------------------------
Including 8.0 9.45 1.48
---------------------------------------------------------
Trench 17 20.0 0.27 1.32
---------------------------------------------------------
Trench 18 27.0 0.64 1.31
---------------------------------------------------------
Trench 19 29.0 0.58 1.82
---------------------------------------------------------
Trench 20 13.0 2.58 7.93
---------------------------------------------------------
Trench 21 17.0 0.13 0.97
---------------------------------------------------------
Trench 22 11.0 0.64 2.89
---------------------------------------------------------
Trench 23 26.0 0.35 2.30
---------------------------------------------------------
Trench 24 7.00 0.17 0.93
---------------------------------------------------------
Trench 25 11.0 0.34 0.95
---------------------------------------------------------
Trench 26 11.0 0.35 0.07
---------------------------------------------------------
Trench 27a 19.0 1.46 14.78
---------------------------------------------------------
Trench 27b 16.0 3.92 9.09
---------------------------------------------------------
Trench 28 26.0 0.61 6.83
---------------------------------------------------------
Trench 29 20.0 0.53 2.68
---------------------------------------------------------
Trench 30 9.0 0.69 1.82
---------------------------------------------------------
Trench 31 9.0 0.58 1.09
---------------------------------------------------------
Trench 32 24.0 2.52 3.44
---------------------------------------------------------
Trench 33 14.0 2.02 3.01
---------------------------------------------------------
Trench 34 35.0 1.68 10.12
---------------------------------------------------------
Trench 35 34.0 0.72 1.18
---------------------------------------------------------
Trench 36 26.0 0.28 0.57
---------------------------------------------------------
Trench 37 33.0 0.24 0.32
---------------------------------------------------------
Trench 38 36.0 0.23 0.36
---------------------------------------------------------
Trench 39 4.0 0.19 0.25
---------------------------------------------------------
Trench 40 59.0 0.72 0.65
---------------------------------------------------------
Trench 41 21.0 0.98 3.76
---------------------------------------------------------
Note that Trenches 21 to 25 are located approximately 500
metres northeast of Miwah Bluff Breccia Zone, and Trench 26
is in between. All composite intervals are un-cut.
Background
The Miwah Property is located within the same volcanic arc as the Martabe high sulphidation gold deposit in North Sumatra (Purnama and Baskara resources: 127.8 million tonnes at 1.4 g/t Au (5.5 million ounces) and 15 g/t Ag (60 million ounces)). The Miwah Property contains a large, high sulphidation epithermal system that is geologically similar to Martabe. It was partially defined by approximately 3000 metres of drilling in eleven holes by a previous explorer in 1997. All holes drilled during this program intersected significant alteration and mineralization with intercepts including 71 metres at 1.4 g/t gold and 58 metres at 1.1 g/t gold. The previous explorer suggested potential for 100 Mt at 1.1 to 1.2 g/t gold, however a review of the historical data indicates that early drilling was clearly parallel to higher grade (greater than 5 g/t gold) structures at surface, and hence significantly higher overall grades are anticipated from better oriented drill holes.
Integration of recent encouraging trench results and historical work, combined with ongoing detailed surface mapping and sampling will form the basis for selecting optimum drill targets which are anticipated to be drill tested later in the year.
Samples reported were assayed at Intertech assay laboratories in Jakarta. David Royle, B.Sc. (Hons), FAusIMM, CP, the designated QP within the meaning of 43-101, has reviewed and approves the content of this release. East Asia has not verified the classification of the resource references and is not treating them as a NI 43-101 defined resources verified by a QP. Although the references of resources are relevant to recognizing the potential of the Miwah project, they should not be relied upon.
About East Asia Minerals Corporation
East Asia Minerals is an Asian-based, Canadian mineral exploration company with gold and copper exploration properties in Indonesia, and uranium exploration properties in Mongolia. In Indonesia the Company has a 70 to 85% interest in six advanced gold and gold-copper properties located in Aceh Province, Sumatra, and Sangihe Island, North Sulawesi. Two of these, the Sangihe (Binebase-Bawone) and Barisan 1 (Abong) gold projects, are being drilled to define NI43-101 compliant resources. The Company owns ten uranium properties, including the advanced Ingiin-Nars, Ulaan Nuur and Enger uranium projects, and a 75% interest in the Khok Adar copper oxide discovery in Mongolia. East Asia currently has 55,645,372 shares outstanding. Its shares are listed for trading on the TSX Venture Exchange under the symbol "EAS".
Forward Looking Statements - This News Release contains forward looking information within the meaning of the British Columbia Securities Act, the Ontario Securities Act and the Alberta Securities Act, which involve known and unknown risks, uncertainties and other factors which may cause the actual results, performance or achievements of the Company, or industry results, to be materially different from any future results, performance or achievements expressed or implied by such forward-looking statements. Forward-looking statements are subject to a variety of risks and uncertainties which could cause actual events or results to differ from those reflected in the forward-looking statements, including, without limitation, risks and uncertainties relating to the interpretation of drill results and the estimation of mineral resources and reserves, the geology, grade and continuity of mineral deposits, the possibility that future exploration, development or mining results will not be consistent with our expectations, metal recoveries, accidents, equipment breakdowns, title matters and surface access, labour disputes or other unanticipated difficulties with or interruptions in production, the potential for delays in exploration or development activities or the completion of new or updated feasibility studies, the inherent uncertainty of production and cost estimates and the potential for unexpected costs and expenses, commodity price fluctuations (including uranium, fuel, steel and construction items), currency fluctuations, failure to obtain adequate financing on a timely basis and other risks and uncertainties. Should one or more of these risks and uncertainties materialize, or should underlying assumptions prove incorrect, actual results may vary materially from those described in forward-looking statements. Accordingly, readers are advised not to place undue reliance on forward-looking statements. The words anticipate, believe, estimate and expect and similar expressions, as they relate to us or our management, are intended to identify forward looking statements relating to the business and affairs of the Company. Except as required under applicable securities legislation, we undertake no obligation to publicly update or revise forward-looking statements, whether as a result of new information, future events or otherwise.
To receive or stop receiving EAS news via email, please email Info@EAminerals.com and state your preference in the subject line.
SOURCE: East Asia Minerals Corporation
Wirtschaftsnews - von heute 13:32
Rio Tinto will Kohleförderung bis 2015 verdoppeln
Stuttgart (www.rohstoffe-go.de) Die Nachfrage nach Kohle steigt stetig an. Die Preise für Kohle haben sich in den letzten fünf Jahren verfünffacht. „Der Ausblick und die Fundamentaldaten sind günstig“ so Preston Chiaro, Chef des Rio-Tinto-Energiesektors. Pro Jahr sollen laut Rio Tinto 15,2 Millionen Tonnen Kokskohle zur Stahlherstellung produziert werden. Kohle, die in Kraftwerken verwendet wird, soll bis 2015 in einem Umfang bis zu rund 49 Millionen Tonnen produziert werden. Auch Analystin Bonnie Liu von der Macquarie Group Ltd. in Schanghai sprach in einer aktuellen Studie von "einem chronisch angespannten Kohlemarkt".
Jul 28, 2008 08:00 ET
Triangle Petroleum Provides Update on Its Shale Programs
CALGARY, ALBERTA--(Marketwire - July 28, 2008) - Triangle Petroleum Corporation (the "Company" or "Triangle") (OTCBB:TPLM) today reported the following update on its Maritimes Basin shale gas programs:
Windsor Block (516,000 gross acres) in Nova Scotia
The Company's first exploration well of the 2008 drilling season, the N-14-A well, was spud earlier this month and is currently drilling. This is a vertical well with a target depth of 3,000 meters (10,000 feet). It is located approximately 5 miles north of Triangle's two original vertical test wells, Kennetcook #1 and Kennetcook #2. The well location was identified based on the interpretation of previous well results and an extensive seismic database. The objective of this well is to penetrate the Horton Bluff shale in a separate, deeper fault block, where the shale is expected to be significantly thicker than anything the Company has drilled to date in the Windsor Block. A comprehensive logging, coring, and laboratory analysis program will be undertaken in order to assist management in determining the most appropriate zones to complete later this fall.
As of the date of this release, the Company has received approximately $6.5 million from its joint venture partners related to the Windsor Block. Approximately $3 million was received from one partner for reimbursement of Triangle's 2007 seismic and test well expenditures and approximately $3.5 million has been received, in advance, from both partners for the drilling of the N-14-A exploration well. The partners have agreed to fund 80% of this well. Triangle is responsible for 20% of the costs and will retain at least a 45% working interest in the wells and associated lands.
Howard Anderson, President of Triangle's operating subsidiaries, states "We are very pleased with our partners' technical and financial participation in the Windsor Block shale project. We look forward to assessing the log and core data from this current drilling program in order to design an appropriate completion, frac, and test program for these wells to be executed in the fourth quarter of this year."
Beech Hill Block (68,000 gross acres) in New Brunswick
The Company has completed the acquisition phase of approximately 30 kilometers (18 miles) of 2-D seismic on the Beech Hill Block. As part of the farm-in agreement, Triangle now has until the end of this year to interpret this data and decide whether or not to drill a well by mid-2009 in order to earn a 70% working interest in this block of land. Zodiac Exploration Corp. has paid $250,000 towards the seismic program, thereby retaining an option to participate in the drilling of the first well. Terms would require Zodiac to pay 50% of Triangle's cost to earn a 25% interest in the lands.
About Triangle Petroleum Corporation
Jul 28, 2008 09:01 ET
Atlas Minerals Presents NI 43-101 Resource Estimate For Tres Chorreras
CALGARY, ALBERTA--(Marketwire - July 28, 2008) - Atlas Minerals Inc. ("the Company" or "Atlas") (TSX VENTURE:AMR) Atlas is pleased to announce the results of a National Instrument 43-101 Resource Estimate for the polymetallic deposit at its Tres Chorreras concession in Ecuador. Results are based on a first phase exploration program and are significant considering the work completed to date. Two deposits have been outlined at Tres Chorreras and both remain open to depth and along strike with numerous additional targets yet to be tested. The company anticipates expanding the resource estimate significantly in future exploration and development programs. You can download a PDF version of this report from our website at http://atlasminerals.ca/?p=115.
The Resource Estimate to date reflects that the Tres Chorreras property comprises significant mineral deposits. Highlights calculated at $20 US/tonne cut-off (see tables and explanation below) are as follows:
1. The 3C Breccia Deposit: predominantly molybdenum-copper
a. Indicated Mineral Resource of 14.096 Mt at 0.080% Mo, and 0.165% Cu; Mo equivalent of 0.099% AND,
b. Inferred Mineral Resource of 15.223 Mt at 0.085% Mo, and 0.177% Cu; Mo equivalent of 0.105%
2. The Epithermal Deposit: predominantly gold-silver
a. Indicated Mineral Resource of 6.508 Mt at 1.1 g/t Au and 9.89g/t Ag AND,
b. Inferred Mineral Resource of 11.865 Mt at 0.82 g/t Au and 11.01g/t Ag
3. Combined 3C Breccia Deposit and Epithermal Deposit:
a. Indicated Mineral Resource of 20.604 Mt at 0.057% Mo, 0.126% Cu, 0.58g/t Au, and 6.28g/t Ag AND,
b. Inferred Mineral Resource of 27.088 Mt at 0.053% Mo, 0.130% Cu, 0.59g/t Au, and 7.36g/t Ag
Other cut-off scenarios are presented below in tables 1-3.
Based on this data and subject to permissions being granted under the new Ecuadorian Mining Law anticipated later this year, Atlas is planning to embark on additional activities:
1. Commission a Preliminary Assessment to ascertain the most logical mining methods, milling process strategies and general economics for the presently known deposits;
2. Undertake additional infill drilling in both deposits to expand and upgrade the resource; and,
3. Continue drilling along strike and to depth in both deposits to further delineate the deposits.
--------------------------------------------------------------------------
Combined (3C Breccia and Epithermal Deposits) Resources at Tres Chorreras
--------------------------------------------------------------------------
TONNES
CUTOFF IN-SITU Mo Cu Au Ag
US$/TONNE X 1000 % % g/t g/t
--------------------------------------------------------------------------
Indicated
--------------------------------------------------------------------------
20 20,604 0.057 0.13 0.58 6.28
--------------------------------------------------------------------------
50 5,114 0.147 0.23 0.70 7.08
--------------------------------------------------------------------------
80 2,103 0.239 0.29 0.73 7.88
--------------------------------------------------------------------------
--------------------------------------------------------------------------
Inferred
--------------------------------------------------------------------------
20 27,088 0.053 0.13 0.59 7.36
--------------------------------------------------------------------------
50 6,664 0.140 0.24 0.78 7.92
--------------------------------------------------------------------------
80 2,917 0.218 0.32 0.89 7.60
--------------------------------------------------------------------------
--------------------------------------------------------------------------
TONNES Mo Cu Au Ag
CUTOFF IN-SITU Millions Millions Thousand Thousand
US$/TONNE X 1000 Lbs Lbs Oz Oz
--------------------------------------------------------------------------
Indicated
--------------------------------------------------------------------------
20 20,604 26 57 383 4,159
--------------------------------------------------------------------------
50 5,114 17 26 115 1,164
--------------------------------------------------------------------------
80 2,103 11 14 49 533
--------------------------------------------------------------------------
--------------------------------------------------------------------------
Inferred
--------------------------------------------------------------------------
20 27,088 32 78 515 6,413
--------------------------------------------------------------------------
50 6,664 21 36 168 1,698
--------------------------------------------------------------------------
80 2,917 14 20 83 712
--------------------------------------------------------------------------
Table 1 (http://atlasminerals.ca/?page_id=117)
Notes on Resource Calculation Tables
1. An 'Indicated Mineral Resource' is the tonnage calculation for that part of a Mineral Deposit for which quantity, grade or quality, densities, shape and physical characteristics, can be calculated with a level of confidence sufficient to allow the appropriate application of technical and economic parameters to categorize these zones as an 'Indicated Mineral Resource'. The calculation is based on detailed and reliable exploration and testing information gathered through appropriate techniques from locations such as outcrops, trenches, underground workings and drill holes that are spaced closely enough for geological and grade continuity to be reasonably assessed.
2. An 'Inferred Mineral Resource' is the tonnage calculation for that part of a Mineral Deposit for which quantity and grade or quality can be calculated on the basis of geological evidence and limited sampling and reasonably assumed, but not verified, geological and grade continuity. The calculation is based on limited information and sampling gathered through appropriate techniques from locations such as outcrops, trenches, underground workings and drill holes. Due to the uncertainty that may be attached to Inferred Mineral Resources, it cannot be assumed that all or any part of an Inferred Mineral Resource will be upgraded to an Indicated or Measured Mineral Resource as a result of continued exploration.
3. Prices used for commodities were; $20.00/lb for molybdenum, $2.30/lb for copper, $600/ounce for gold, $12.00/ounce for silver. NET IN-SUTU Value US$ calculations and cut-off grade calculation (CUTOFF $/TONNE) are based on these prices. These prices are based on an analysis of the past 1 year, 3 year and 5 year rolling average calculations. The 5 year rolling average was selected as a conservative calculation for metal prices going forward with the exception of molybdenum which has a 5-year back average of $28.00 and a current price of approximately $33.50. It was decided that a more conservative value for molybdenum should be utilized and $20.00 per pound (or approximately 60% of the current price) was selected.
4. Mo Equivalent was calculated as Mo% + 0.115 X Cu% assuming 100% recovery.
5. Au Equivalent was calculated as Au g/t + 0.02 X Ag g/t assuming 100% recovery.
6. Resources are presented at three economic cut-off levels:
a) A CUTOFF VALUE of US$20/tonne is provided to demonstrate overall in-situ mineral content, which defines the known key resource.
b) A CUTOFF VALUE of $50/tonne provides a mid-level cost cutoff for operations, which would reflect medium level underground mining and milling costs and is provided for the reader's use.
c) A CUTOFF VALUE of $80/tonne is presented as base case for high cost / selective high grade underground mining methods similar to the nearby Rio Blanco Project.
KEY ISSUES
- This Resource Calculation is based on an evaluation of both the 3C Breccia and the adjoining Epithermal Deposits on the concession and indicates substantial volumes in both deposits both of which are open in two directions. Atlas is therefore greatly encouraged to undertake further development to improve the understanding of the deposits with the view to expand the tonnage and increase confidence in the resource.
- The Ecuadorian Government stated position on mining development of any project repeatedly has been that (i) it should be of demonstrable economic benefit to the country; (ii) there should be clear benefit for the surrounding population; and, (iii) the project should be managed with a high standard of environmental care. This Resource Calculation demonstrates significant potential for national economic benefit from this project, and along with Atlas' positive social and environmental activities to-date, aligns the company's activities entirely with Government requirements for responsible mining projects.
- In the last few months a general description of the Tres Chorreras project and an estimate of the potential of the Tres Chorreras concession have been shared with Ecuadorian government officials. Further talks are now anticipated to discuss these specific results and a proposed expansion of Atlas exploration activities in the area.
- The Indicated Mineral Resource Estimate and Inferred Mineral Resource Estimate gives impetus to the demonstrable seriousness of this project and opens the door to developing a major mining project in Pucara County where, although artisan mining has been a way of life for years, young people are now leaving and job possibilities are few.
- Remodelling of the deposits shows continued mineralization to depth and indicates the potential for a large porphyry style deposit associated with the 3C Breccia Deposit. The potential to expand the current resources is considered excellent.
- The 3C Breccia and The Epithermal deposits are located parallel to and approximately 20 metres apart from one another, thus the deposits could be amenable for extraction from the same mine development.
TECHNICAL DATA
In order to provide the required information for this report, Atlas has carried out substantial underground sampling in the +5000-m of tunnelling and carried out a 6000-m diamond drilling program terminating in April 2008. This data was used to delineate both the 3C Breccia Deposit and the parallel Epithermal Deposit.
Further studies will be carried out to determine optimal mining methods and economic viability. Cutoff grades, mining methods and mineral recoveries will be the focus of future studies such as "Preliminary Assessment" and/or "Pre-feasibility Study" which are planned to determine the viability of these options.
3 Dimensional projection looking N.E. (http://atlasminerals.ca/?page_id=116)
3C Breccia Deposit:
The 3C Breccia Deposit is a zone of fracturing, faulting and brecciation which roughly parallels the contact between an irregular stock of silicified and tourmalinized microdiorite and host rhyolitic volcanic rocks. Molybdenite, chalcopyrite, pyrite, specularite and magnetite with associated gold and silver values, occur as disseminations and in pockets of massive sulphides in breccia pipes. In addition, mineralization is controlled by fracture stockworks of varying intensity beyond and in between the breccia pipes. This deposit shows remarkable similarity to the large Los Bronces breccia deposits in central Chile. The 3C Breccia Deposit is still open to the north and to depth. Results are as follows:
--------------------------------------------------------------------------
3C Breccia Deposit
--------------------------------------------------------------------------
TONNES Mo Au
CUTOFF In-Situ Mo Cu Equiv Au Ag Equiv
US$/Tonne X 1000 % % ppm g/t g/t g/t
--------------------------------------------------------------------------
Indicated
--------------------------------------------------------------------------
20 14,096 0.080 0.16 0.099 0.34 4.61 0.43
--------------------------------------------------------------------------
50 4,707 0.159 0.24 0.187 0.53 6.40 0.66
--------------------------------------------------------------------------
80 2,065 0.243 0.30 0.277 0.65 7.56 0.80
--------------------------------------------------------------------------
--------------------------------------------------------------------------
Inferred
--------------------------------------------------------------------------
20 15,223 0.085 0.18 0.105 0.41 4.49 0.50
--------------------------------------------------------------------------
50 5,972 0.154 0.26 0.183 0.68 5.98 0.80
--------------------------------------------------------------------------
80 2,842 0.223 0.32 0.259 0.84 7.10 0.98
--------------------------------------------------------------------------
----------------------------------------------------------
TONNES Mo Cu Au Ag
CUTOFF In-Situ Lbs Lbs Oz Oz
US$/Tonne X 1000 X 1000 X 1000 X 1000 X 1000
----------------------------------------------------------
Indicated
----------------------------------------------------------
20 14,096 25,009 51,184 152 2,089
----------------------------------------------------------
50 4,707 16,464 25,304 81 969
----------------------------------------------------------
80 2,065 11,060 13,547 43 502
----------------------------------------------------------
----------------------------------------------------------
Inferred
----------------------------------------------------------
20 15,223 28,550 59,291 201 2,198
----------------------------------------------------------
50 5,972 20,278 33,577 130 1,148
----------------------------------------------------------
80 2,842 13,956 19,917 76 649
----------------------------------------------------------
Table 2 (http://atlasminerals.ca/?page_id=118)
The Epithermal Deposit:
The Epithermal Deposit lies approximately 20m southwest of and parallel to the 3C Breccia Deposit. It is a low sulfidation system of sub-parallel thin (often less than 2 cm wide) quartz veins, often with Au bearing mineralized deposits with no obvious vein set present. The main values are Au and Ag, with nominal values in Cu and Mo. Visible gold is found within this deposit. The Epithermal Deposit is open to depth and to the south. Results are as follows:
--------------------------------------------------------------------------
Epithermal Deposit
--------------------------------------------------------------------------
TONNES Mo Au
CUTOFF In-Situ Mo Cu Equiv Au Ag Equiv
US$/Tonne X 1000 % % ppm g/t g/t g/t
--------------------------------------------------------------------------
Indicated
--------------------------------------------------------------------------
20 6,508 0.007 0.04 0.011 1.11 9.89 1.30
--------------------------------------------------------------------------
50 407 0.013 0.06 0.020 2.60 14.93 2.90
--------------------------------------------------------------------------
80 38 0.012 0.07 0.020 5.13 25.04 5.63
--------------------------------------------------------------------------
--------------------------------------------------------------------------
Inferred
--------------------------------------------------------------------------
20 11,865 0.012 0.07 0.020 0.82 11.05 1.04
--------------------------------------------------------------------------
50 692 0.022 0.15 0.039 1.71 24.68 2.21
--------------------------------------------------------------------------
80 75 0.029 0.24 0.057 2.91 26.47 3.44
--------------------------------------------------------------------------
----------------------------------------------------------
TONNES Mo Cu Au Ag
CUTOFF In-Situ Lbs Lbs Oz Oz
US$/Tonne X 1000 X 1000 X 1000 X 1000 X 1000
----------------------------------------------------------
Indicated
----------------------------------------------------------
20 6,508 964 5,880 231 2,069
----------------------------------------------------------
50 4,067 112 570 34 195
----------------------------------------------------------
80 38 10 56 6 31
----------------------------------------------------------
----------------------------------------------------------
Inferred
----------------------------------------------------------
20 11,865 3,225 18,258 314 4,215
----------------------------------------------------------
50 692 343 2,250 38 549
----------------------------------------------------------
80 75 48 396 7 63
----------------------------------------------------------
Table 3 (http://atlasminerals.ca/?page_id=119)
The Epithermal Deposit has over 6.5 million tonnes in the Indicated Resource category grading over 1 g/t Au equivalent and over 11.8 million tonnes in the Inferred Resource category grading over 0.8 g/t with nominal Cu and Mo. High grade zones are evident, but with nominal tonnages. This deposit will be examined by the company in the future to assess the potential for low cost bulk mining and, possibly, heap leach extraction techniques. This deposit has not been extensively explored and remains open to the south and to depth.
The cutoff grades used were calculated applying all four metals to determine a total in-situ rock value and the range of expected mining, processing and administrative costs as compared to known similar sized deposits. Assumptions used in the calculation of the resources are included under Supporting Technical Data.
SUPPORTING TECHNICAL DATA:
The Resource Calculation is based on an evaluation of both the 3C Breccia and Epithermal Deposits on the concession. The substantial volumes with several open boundaries give great encouragement for further enhancement of both Category and Size of the deposits.
A total of 42 drill holes were used totalling a combined 6,942 metres of drilling (of which 6,000 metres was recently completed in early 2008). In addition, 1027 underground samples were collected from 2,212 metres of underground tunnelling. A total of 4859 assays were used in the calculations with the length of samples in the range of 0.25 metres to 8 metres with approximately 95% of the samples being standard 2 metres in length. All information was in metric units and these units were used in the resource estimate.
Cores were split and sampled in the field, sealed and shipped under supervision to the preparation laboratories of Acme Labs in Cuenca, Ecuador or to Inspectorate Labs in Quito, Ecuador where they were crushed and split. Sample pulps were then shipped to Acme Laboratories in Vancouver, B.C. or Santiago, Chile or to Inspectorate Labs in Lima for chemical analysis. The standard analytic technique involved 30 element ICP-ES or ICP-MS and included Mo, Cu, Au and Ag in ppm. The quality control system of Acme and Inspectorate complies with the requirements for the ISO 9001:2000 and ISO 17025. Analytical accuracy and precision are monitored by the inclusion and analysis of reagent blanks, reference material and replicate samples. Quality control is further assured by the use of international standards.
A total of 282 specific gravity determinations were available and used to determine bulk density of the various zones in the deposits. These measurements were completed by Atlas field staff.
Composites of 2.5 metres in length were created from the drill hole data. This and the underground sample data were imported into a composite database. The block models for the deposits were calculated using the length weighted composites which employed ordinary kriging. Distance limiting was employed to include use of high value assays but to limit the area of their influence to 10 metres in the Epithermal Deposit and to 30 metres in the 3C Breccia Deposit.
Tres Chorreras has highly variable mineral content within the 3C Breccia Deposit dominant in Mo and Cu and within the Epithermal Deposit dominant in Au and Ag. To permit a resource estimate, an in-situ value in US$ was calculated making use of reasonable metal prices.
The Tres Chorreras Property consists of 49 Hectares of licensed claims. Atlas holds 100% interest in the Tres Chorreras property with no outstanding royalty positions.
Qualified persons and quality control/quality assurance:
The resource calculations reported in this press release were calculated by Robert Morris, M. Sc., P. Geo. of Moose Mountain Technical Services (MMTS) and Garth Kirkham, P. Geo. of Kirkham Geosystems Ltd. (KGL) who are from British Columbia, Canada and are Independent Qualified Persons as defined by NI 43-101 and are responsible for the technical material contained in the NI 43-101 resource calculation report. As required by NI 43-101 regulations, the resource calculation will be filed on SEDAR in its entirety within 45 days following the date of this press release.
The exploration program at Tres Chorreras was designed and supervised by Donald G. Allen, P. Eng. (B.C.), Vice-President of Exploration, Atlas Minerals, who was responsible for all aspects of the work, including the quality control/quality assurance program. Mr. Allen is a qualified person as defined by National Instrument 43-101.
This news release was prepared under the auspices of Leslie Smith, P.Geol. (Alberta), consultant to the company, and also a qualified person under National Instrument 43-101. It has been reviewed for accuracy by Don Allen, P. Eng., Robert J. Morris, M.Sc., P. Geo., and Garth Kirkham, P. Geo.
CAUTION CONCERNING FORWARD-LOOKING STATEMENTS: This press release concerns certain "forward-looking statements", which may include, but not limited to, the statements regarding the Company's strategic plan, work programs and exploration budgets at the Company's Tres Chorreras Project. The forward looking statements express, as at the date of this press release, the Company's plans, calculations, forecasts, projections, expectations or beliefs as to future events and results. Forward-looking statements involve a number of risks and uncertainties, and there can be no assurance that such statements will prove to be accurate. Therefore, actual results and future events could differ materially from those anticipated in such statements. Risks and uncertainties that could cause results or future events to differ materially from current expectations expressed or implied by the forward-looking statements include, but are not limited to, factors associated with industry risks, risks associated with foreign operations, environmental risks and hazards and other risks.
Close: $0.10
Shares outstanding: 31,236,036
Jul 28, 2008 09:02 ET
Millstream Submits NI 43-101 Report on Tamarack Gold Property
TORONTO, ONTARIO--(Marketwire - July 28, 2008) - Millstream Mines Ltd. (TSX VENTURE:MLM)(FRANKFURT:NJD) is pleased to announce that it has filed on SEDAR and the company's website an NI 43-101 compliant Geologic Report on its Tamarack Gold Property located near Sheridan, Montana, USA.
Also, Millstream has granted to members of its Board of Directors incentive stock options as defined by its approved Stock Option Plan a total of 900,000 options exercisable at a price of $0.14 for a period of five years to June 5, 2013. Millstream has also granted a total of 250,000 options to a consultant of the company exercisable at a weighted average price(i) of $0.30 until Dec. 31, 2008.
(i) (100,000 at $0.25; 50,000 at $0.30; 100,000 at $0.35)
About Millstream Mines Ltd.:
Millstream Mines Ltd. is a Canadian-based mineral exploration company whose principle objective is to enhance and develop known mineral properties to production potential. The Company has active projects in the Province of Ontario, Canada and in the State of Montana, USA. The past producing Potter Mine Property is host to copper-zinc-cobalt "stacked" mineralized zones located in the highly prolific Abitibi Greenstone Belt and more specifically in the Kidd-Munro Assemblage near the town of Matheson in north eastern Ontario. A recently published initial NI 43-101 compliant resource estimate on the Potter revealed an indicated resource of 3,028,767 tonnes at 1.45% copper, 1.19% zinc, 389.7 ppm cobalt, 11.1 ppm silver, and 127.5 ppb gold along with an inferred resource of 2,071,101 tonnes at 1.08 % copper, 1.05 % zinc, 301.4 ppm cobalt, 8.7 ppm silver, and 81.7 ppb gold. The Tamarack Gold Property, a high grade former gold producer in the Tobacco Root Mountains of south western Montana, is in an advanced stage of underground exploration and development operating under the Small Mines Exclusion Act of the State of Montana.
64,051,707 SHARES ISSUED
July 25, '08 Close: $0.08
The TSX Venture Exchange has not reviewed and does not accept responsibility for the adequacy or accuracy of this release. Millstream seeks safe harbour with regard to forward looking statements.
Interessantes Uran-Potash Play mit indirekter Beteiligung in den James Bay Lowlands (Noront-Area) und das ganze dreimal um die Ecke gedacht...
Trigon Uranium
halten 38% an International Potash Corp (+ Optionen um auf 50% zu kommen), einer Firma, die im SW der USA Lizenzen haelt
halten so einige Uran-Lizenzen in den USA
haben 10mio Shares Diamondex Exploration (TSX-V:DSP) fuer einen Verkauf ihrer Liegenschaften in den James Bay Lowlands erhalten (urspruenglich ein Diamantprojekt)
Struktur
Shares Out: 60.335 millions
Quoted Market Value: 18.704 mio CAD
Achtung, niedrige Cash-Posi, da kommt demnaechst ein Financing
Chart (Ende Mai wurde der Kauf der 50% Option bekanntgegeben)

Potential:
Uran (selber)
Potash (teils selber)
Diamondex (indirekt)
einen hidden value sehe ich v.a. in der 10mio share Beteiligung von DSP, man kann die natuerlich auch direkt spielen,
DSP
Share Structure
Shares Outstanding: 173,872,667
Fully Diluted Shares: 187,242,667
Working Capital: $ 6 million
Fully Diluted Cash Position: $ 14 million

DSP hat gerade mit Canada Nickel (noch private Firma, IPO im Herbst) einen Deal abgeschlossen, wonach Canada Nickel 51% an dem Projekt erwerben kann wenn man, es wird erhebliches Kapital eingesetzt, da sollten zuegig Ergebnisse folgen:
having made a $5 million cash payment to Diamondex (which earns Canada Nickel a 10% interest in the Property); and
funding $5 million in exploration expenditures on or before July 7, 2009 (which earns Canada Nickel a further 12% interest in the Property); and
funding a further $7 million in exploration expenditures on or before July 7, 2010 (which earns Canada Nickel a further 14% interest in the Property); and
funding a further $8 million in exploration expenditures on or before July 7, 2011 (which earns Canada Nickel a further 15% interest, for a total interest of 51%).
und nun der Clou fuer alle, die zweimal um die Ecke denken, Southern Arc hat einen Teil seiner Cash-Posi in das Private pre-IPO placement bei Canada Nickel gesteckt:
July 8, 2008
Vancouver, B.C.:
Southern Arc Minerals Inc. (TSX-V: SA) (“Southern Arc” or the “Company”) is pleased to announce a strategic investment in Canada Nickel Corp. (“Canada Nickel”), a new private company. Southern Arc has purchased 15.3 million common shares for $5.355 million.
warum also Trigon:
Uran wird wieder sexy
Potash im Hype
indirektes Play auf James Bay Lowlands
Trigon Uranium
halten 38% an International Potash Corp (+ Optionen um auf 50% zu kommen), einer Firma, die im SW der USA Lizenzen haelt
halten so einige Uran-Lizenzen in den USA
haben 10mio Shares Diamondex Exploration (TSX-V:DSP) fuer einen Verkauf ihrer Liegenschaften in den James Bay Lowlands erhalten (urspruenglich ein Diamantprojekt)
Struktur
Shares Out: 60.335 millions
Quoted Market Value: 18.704 mio CAD
Achtung, niedrige Cash-Posi, da kommt demnaechst ein Financing
Chart (Ende Mai wurde der Kauf der 50% Option bekanntgegeben)
Potential:
Uran (selber)
Potash (teils selber)
Diamondex (indirekt)
einen hidden value sehe ich v.a. in der 10mio share Beteiligung von DSP, man kann die natuerlich auch direkt spielen,
DSP
Share Structure
Shares Outstanding: 173,872,667
Fully Diluted Shares: 187,242,667
Working Capital: $ 6 million
Fully Diluted Cash Position: $ 14 million
DSP hat gerade mit Canada Nickel (noch private Firma, IPO im Herbst) einen Deal abgeschlossen, wonach Canada Nickel 51% an dem Projekt erwerben kann wenn man, es wird erhebliches Kapital eingesetzt, da sollten zuegig Ergebnisse folgen:
having made a $5 million cash payment to Diamondex (which earns Canada Nickel a 10% interest in the Property); and
funding $5 million in exploration expenditures on or before July 7, 2009 (which earns Canada Nickel a further 12% interest in the Property); and
funding a further $7 million in exploration expenditures on or before July 7, 2010 (which earns Canada Nickel a further 14% interest in the Property); and
funding a further $8 million in exploration expenditures on or before July 7, 2011 (which earns Canada Nickel a further 15% interest, for a total interest of 51%).
und nun der Clou fuer alle, die zweimal um die Ecke denken, Southern Arc hat einen Teil seiner Cash-Posi in das Private pre-IPO placement bei Canada Nickel gesteckt:
July 8, 2008
Vancouver, B.C.:
Southern Arc Minerals Inc. (TSX-V: SA) (“Southern Arc” or the “Company”) is pleased to announce a strategic investment in Canada Nickel Corp. (“Canada Nickel”), a new private company. Southern Arc has purchased 15.3 million common shares for $5.355 million.
warum also Trigon:
Uran wird wieder sexy
Potash im Hype
indirektes Play auf James Bay Lowlands
Interessantes Uran-Potash Play mit indirekter Beteiligung in den James Bay Lowlands (Noront-Area) und das ganze dreimal um die Ecke gedacht...
Trigon Uranium
halten 38% an International Potash Corp (+ Optionen um auf 50% zu kommen), einer Firma, die im SW der USA Lizenzen haelt
halten so einige Uran-Lizenzen in den USA
haben 10mio Shares Diamondex Exploration (TSX-V:DSP) fuer einen Verkauf ihrer Liegenschaften in den James Bay Lowlands erhalten (urspruenglich ein Diamantprojekt)
Struktur
Shares Out: 60.335 millions
Quoted Market Value: 18.704 mio CAD
Achtung, niedrige Cash-Posi, da kommt demnaechst ein Financing
Chart (Ende Mai wurde der Kauf der 50% Option bekanntgegeben)
Potential:
Uran (selber)
Potash (teils selber)
Diamondex (indirekt)
einen hidden value sehe ich v.a. in der 10mio share Beteiligung von DSP, man kann die natuerlich auch direkt spielen,
DSP
Share Structure
Shares Outstanding: 173,872,667
Fully Diluted Shares: 187,242,667
Working Capital: $ 6 million
Fully Diluted Cash Position: $ 14 million
DSP hat gerade mit Canada Nickel (noch private Firma, IPO im Herbst) einen Deal abgeschlossen, wonach Canada Nickel 51% an dem Projekt erwerben kann wenn man, es wird erhebliches Kapital eingesetzt, da sollten zuegig Ergebnisse folgen:
having made a $5 million cash payment to Diamondex (which earns Canada Nickel a 10% interest in the Property); and
funding $5 million in exploration expenditures on or before July 7, 2009 (which earns Canada Nickel a further 12% interest in the Property); and
funding a further $7 million in exploration expenditures on or before July 7, 2010 (which earns Canada Nickel a further 14% interest in the Property); and
funding a further $8 million in exploration expenditures on or before July 7, 2011 (which earns Canada Nickel a further 15% interest, for a total interest of 51%).
und nun der Clou fuer alle, die zweimal um die Ecke denken, Southern Arc hat einen Teil seiner Cash-Posi in das Private pre-IPO placement bei Canada Nickel gesteckt:
July 8, 2008
Vancouver, B.C.:
Southern Arc Minerals Inc. (TSX-V: SA) (“Southern Arc” or the “Company”) is pleased to announce a strategic investment in Canada Nickel Corp. (“Canada Nickel”), a new private company. Southern Arc has purchased 15.3 million common shares for $5.355 million.
warum also Trigon:
Uran wird wieder sexy
Potash im Hype
indirektes Play auf James Bay Lowlands
Jul 28, 2008 09:57 ET
Goldsource Drills 23.2 Metre Coal Intercept at Border Property
VANCOUVER, BRITISH COLUMBIA--(Marketwire - July 28, 2008) - Goldsource Mines Inc. (the "Company") (TSX VENTURE:GXS) announces that it has completed hole BD08-02 which is the fifth hole including the discovery holes, to be completed on its coal permits of the Border Property near Hudson Bay, Saskatchewan.
Hole BD08-02 was drilled approximately 3.0 kilometres to the northwest of initial discovery hole BD08-03 (see attached drill plan, available at: http://media3.marketwire.com/docs/gxs0728map.pdf). The hole was drilled to a depth of 108.5 metres and was lost at this depth due to down-hole problems. The hole encountered a coal intercept of 23.2 metres between 81.6 metres and 104.8 metres. Two continuous coal intervals of 12.4 metres and 7.5 metres thick were encountered from 81.6 - 94.0 metres and 97.3 - 104.8 metres respectively. The coal in both intervals is black, hard and dull to shiny with few visible partings and appears comparable to that of the intercepts of the discovery holes which were ranked as sub-bituminous to bituminous. This intercept included a 3.3 metre internal parting of carbonaceous sand with coal fragments from 94.0 to 97.3 metres. The Company cautions against placing undue reliance on the visual observations of the coal until the results of the analytical work have been announced.
The glacial till and mudstones overlying the top of the seam are also consistent with that encountered in the discovery holes. There is only about 1.7 metres difference in the elevations of the top of the seam in this hole and the nearest discovery hole BD08-03 although the holes are approximately 3.0 kilometres apart. Hole BD08-02 was located based on a continuing review of the available geophysical data, both airborne and down-hole, the emerging geophysical signature of the coal seam in the discovery holes and the geological data obtained in the first four holes.
Hole BD08-04, the fourth hole drilled, was located approximately 2.5 kilometres south of BD08-01, the third hole drilled and was completed to a depth of 85.8 metres. As previously announced, (press release dated July 21, 2008), this hole intersected approximately 8.3 metres of carbonaceous mudstone, minor coal seams and sand partings at the base of the overburden from 28.0 metres to 36.3 metres. This mixed coal interval was followed by Lower Mannville mudstones and Devonian limestones. The hole was drilled well into the Devonian "basement" to ensure a complete downhole geophysical log for comparative use and geologic interpretation with respect to other drill holes.
Hole BD08-03A is currently being drilled and is an offset to the discovery hole BD08-03. This hole is approximately 50 metres east of the original site and will provide the Company with more reliable coal samples for analyses as well as down-hole geophysics. Upon completion of this offset hole, the drill will be moved to BD08-05 which will be located approximately 3.0 kilometres to the northeast of BD08-02, and approximately 4.5 kilometres to the northwest of initial discovery hole BD08-03.
J. Scott Drever, President stated; "The coal intercept in BD08-02 reinforces our initial assumption that there may be a main coal basin with multiple sub-basins. We believe that the discovery holes and this most recent hole BD08-02 were drilled within these sub-basins and that holes BD08-01 and of BD08-04 may have been on the eastern margins of one of the sub-basins. I wish to reiterate that we are in the very early stages of exploration of a new coal discovery. This is "raw" exploration and we are working from a limited technical database. We are methodically building a geological model for the deposition of the coal and the impacts of paleo-topography and glaciation on the deposit. Considerable additional data is required to establish the size, nature and the continuity of the Durango Coal Seam."
N. Eric Fier, CPG, P.Eng. and Qualified Person for this news release has reviewed and approved its contents.
This news release contains forward-looking statements, which address future events and conditions, which are subject to various risks and uncertainties. The Company's actual results, programs and financial position could differ materially from those anticipated in such forward-looking statements as a result of numerous factors, some of which may be beyond the Company's control. These factors include: the availability of funds; the timing and content of work programs; results of exploration activities and development of mineral properties, the interpretation of drilling results and other geological data, the uncertainties of resource and reserve estimations, receipt and security of coal permits and mineral property titles; project cost overruns or unanticipated costs and expenses, fluctuations in commodity product prices; currency fluctuations; and general market and industry conditions. Forward-looking statements are based on the expectations and opinions of the Company's management on the date the statements are made. The assumptions used in the preparation of such statements, although considered reasonable at the time of preparation, may prove to be imprecise and, as such, undue reliance should not be placed on forward-looking statements.
On Behalf of the Board of Directors of
Goldsource Mines Inc.
J. Scott Drever, President
The TSX-Venture Exchange has not reviewed and does not accept responsibility for the accuracy or adequacy of this release.
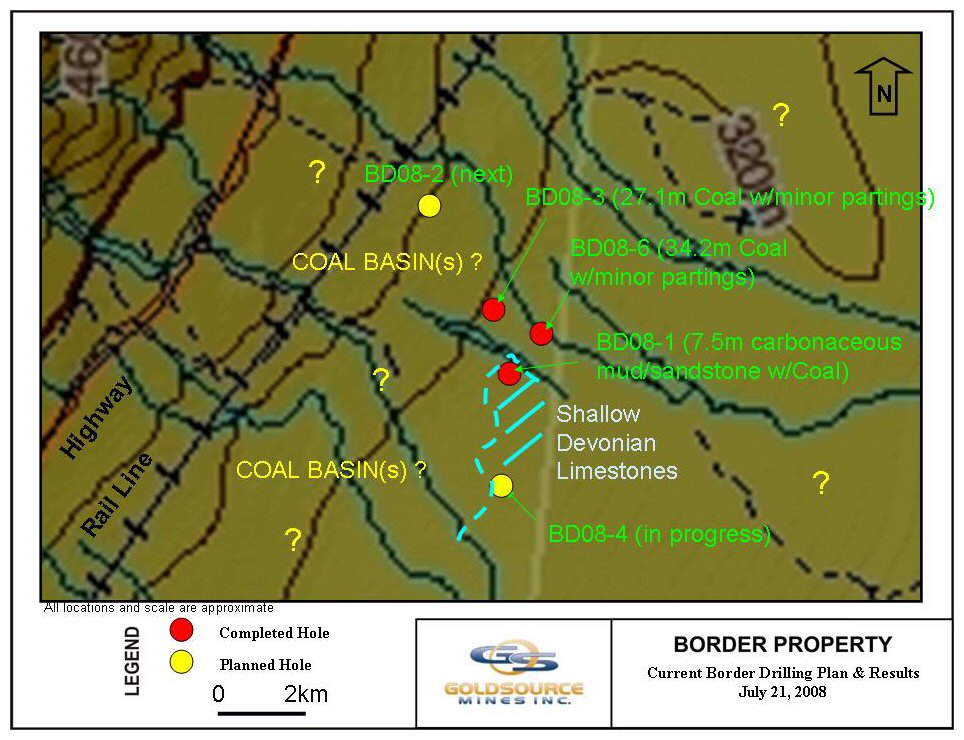

- Status
- Für weitere Antworten geschlossen.