Rohstoffthread (Archiv)

Status
Für weitere Antworten geschlossen.
02.08.2013 11:14 Uhr | Eugen Weinberg
Zyklische Rohstoffe im Höhenflug

Energie

Die Ölpreise können ihren Höhenflug bis zuletzt fortsetzen. Der Brentölpreis stieg in der Nacht erstmals seit April über die Marke von 110 USD je Barrel. WTI handelt nur noch knapp unter dem Mitte Juli verzeichneten 16-Monatshoch von gut 109 USD je Barrel. Seit Wochenmitte ist WTI um mehr als 5% gestiegen. Brent verteuerte sich im selben Zeitraum um knapp 4%. Aufgrund zuletzt besserer Konjunkturdaten aus den USA und China haben sich die Nachfrageperspektiven deutlich aufgehellt (siehe auch Industriemetalle auf Seite 2). Dies gibt den Ölpreisen ebenso Rückenwind wie die weiterhin bestehenden Angebotsrisiken. In Libyen hat die protestbedingte Schließung der beiden wichtigsten Exportterminals dazu geführt, dass die Ölexporte des Landes auf gut 400 Tsd. Barrel pro Tag gesunken sind. Das ist weniger als die Hälfte der normalen Exportmenge und das niedrigste Niveau seit dem Ende des Bürgerkrieges.

Die Lieferausfälle in Libyen waren bereits ein Grund dafür, dass die OPEC-Produktion im Juli gefallen ist. Laut dem Beratungsunternehmen Oil Movements führt die OPEC ihr Angebot in den kommenden Wochen weiter zurück. Die OPEC-Lieferungen sollen in den vier Wochen zum 17. August um 500 Tsd. Barrel pro Tag zurückgehen, was dem stärksten Rückgang seit Anfang Januar entspricht. Oil Movements führt dies zwar auf eine saisonbedingt geringere Nachfrage zurück, da viele Raffinerien im Spätsommer Wartungsarbeiten durchführen. Dennoch dürfte die starke Angebotsreduktion im gegenwärtigen Umfeld von den Marktteilnehmern als preisunterstützend interpretiert werden. Gute US-Arbeitsmarktdaten dürften den Preisen heute weiteren Auftrieb geben.


Edelmetalle

Der Goldpreis kam gestern im Zuge abermals überraschend guter US-Konjunkturdaten und in Folge dessen fester Aktienmärkte (siehe Industriemetalle auf Seite 2) merklich unter Druck. Auch der daraufhin gegenüber dem Euro aufwertende US-Dollar wirkte sich belastend aus, ebenso der Anstieg der Renditen 10-jähriger US-Staatsanleihen auf über 2,7%. Der Abwärtstrend setzt sich heute Morgen fort und Gold fällt erstmals seit knapp zwei Wochen wieder unter die Marke von 1.300 USD je Feinunze. Mit gut 1.280 USD handelt das gelbe Edelmetall auf einem 2-Wochentief. Offensichtlich befanden sich um 1.300 USD herum einige Stopp-Marken, deren Unterschreiten zu technischen Anschlussverkäufen führte. Auch in Euro gerechnet gibt Gold stark nach und notiert mit gut 970 EUR je Feinunze ebenfalls auf einem 2-Wochentief.

In Erwartung eines positiven US-Arbeitsmarktberichts, der heute Nachmittag veröffentlicht wird, haben sich einige Marktteilnehmer anscheinend von Positionen getrennt. Die gestrige EZB-Sitzung hatte wie von uns erwartet dagegen kaum Auswirkungen auf den Goldpreis. Nach einigen Tagen ohne Abflüsse bzw. sogar leichten Zuflüssen wurden die Bestände der von Bloomberg erfassten Gold-ETFs gestern doch wieder um 6,2 Tonnen reduziert. Daten der US-Münzanstalt zufolge wurden im Juli 50.500 Unzen Goldmünzen verkauft, so wenig wie in keinem anderen Monat bislang in diesem Jahr. Allerdings ist der Juli ein saisonal schwacher Monat. Zudem lagen die Münzabsätze deutlich über dem Vorjahr.

gs51fb781db9d8f.png


Industriemetalle

Die Metallpreise erhielten gestern von abermals überraschend positiven Konjunkturdaten in den USA Aufwind. Der ISM-Index für das verarbeitende Gewerbe ist im Juli auf 55,4 und damit ein 2-Jahreshoch gestiegen. Nach einer Schwächephase scheint sich das verarbeitende Gewerbe wieder klar zu erholen, was auf eine wirtschaftliche Beschleunigung in der zweiten Jahreshälfte hindeutet. Zudem sind die Erstanträge auf Arbeitslosenunterstützung in der vergangenen Woche auf den niedrigsten Stand seit Anfang 2008 gesunken, was eine spürbare Verbesserung am US-Arbeitsmarkt signalisiert. Im Zuge dessen legten die Aktienmärkte merklich zu - der S&P 500 stieg erstmals über 1.700 Punkte und auch der Dow Jones Industrial Average schloss auf einem Rekordhoch -, was den zyklischen Rohstoffen wie Industriemetallen Auftrieb verlieh. Kupfer übersprang daraufhin mühelos die Marke von 7.000 USD je Tonne und auch die anderen Industriemetalle legten teilweise kräftig zu.

Noch stärkere Preiszuwächse wurden durch den festen US-Dollar verhindert. Heute Morgen geben die Metalle aufgrund von Gewinnmitnahmen leicht nach. Bevor nächste Woche wieder mehr metallspezifische Daten im Mittelpunkt des Marktinteresses stehen - in China werden beispielsweise die vorläufigen Importdaten für Juli bekannt gegeben -, erhalten zum Wochenausklang nochmals Konjunkturdaten Aufmerksamkeit. Sollte der Arbeitsmarktbericht in den USA, der heute Nachmittag veröffentlicht wird, ebenfalls positiv überraschen, dürften die Metallpreise nochmals kräftig anziehen.


Agrarrohstoffe

Der meistgehandelte Mais-Terminkontrakt an der CBOT gab gestern um weitere 2,5% nach und erreichte mit 4,64 USD je Scheffel ein 3-Jahrestief. Die Aussicht auf eine Rekordernte setzt dem Maispreis weiter zu. Der International Grains Council hat seine Prognose für die globale Maisernte im Erntejahr 2013/14 zwar um 4 Mio. Tonnen reduziert, erwartet aber noch immer einen Anstieg um 10% gegenüber dem Vorjahr auf ein Rekordniveau von 942 Mio. Tonnen. Die weltweite Nachfrage soll dagegen "nur" um 5% auf 915 Mio. Tonnen steigen, woraus ein globaler Angebotsüberschuss von 27 Mio. Tonnen und ein Anstieg der weltweiten Lagerendbestände auf 148 Mio. Tonnen resultiert. Der Rohstoffbroker INTL FCStone rechnet in seiner ersten Prognose mit einer US-Maisernte von knapp 14 Mrd. Scheffel und positioniert sich damit etwas oberhalb der Schätzung des US-Landwirtschaftsministeriums.

Angesichts der zuletzt optimalen Witterungs- und Wachstumsbedingungen könnte auch das USDA seine Ernteprognose anheben. Dennoch erachten wir das Abwärtspotenzial für Mais als begrenzt, da der Großteil der positiven Nachrichten zum Angebot mittlerweile im niedrigeren Preisniveau berücksichtigt sein dürfte. Zudem dürfte das deutlich gesunkene Preisniveau die Nachfrage ansteigen lassen. Eine nennenswerte Erholung der Preise ist allerdings unwahrscheinlich, solange das Wetter keine Abstriche bei den Ernteschätzungen erforderlich macht.
 
02.08.2013 08:38 Uhr | Thomas May
Aktuelle Markteinschätzung zu Gold

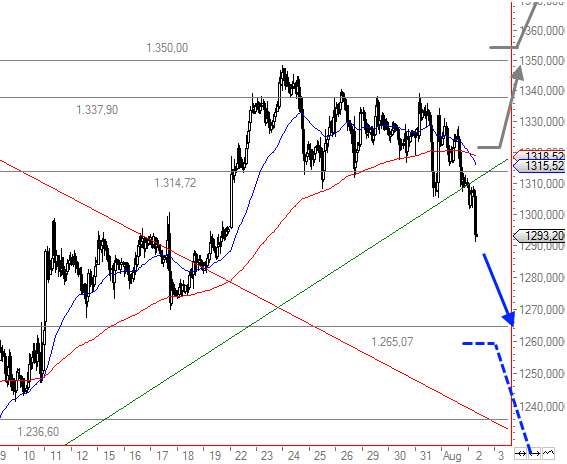
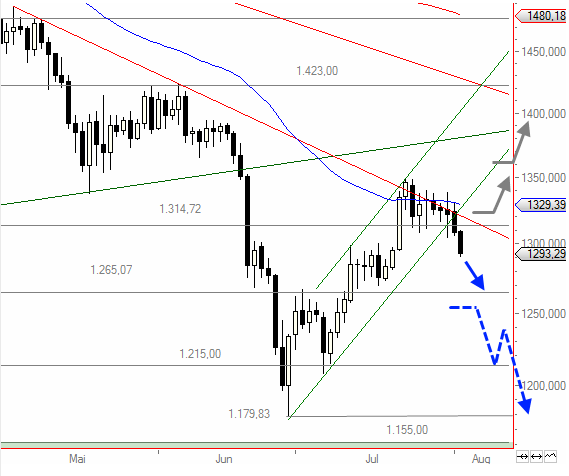
Der Goldpreis stieg in den letzten Wochen in einem Aufwärtstrendkanal bis an seine mittelfristige Abwärtstrendlinie.Nach einer Seitwärtskonsolidierung unterhalb des Widerstands bei $1.350,00 erhöhten die Bullen gestern den Druck und durchbrechen aktuell sowohl den Trendkanal als auch die wichtige Unterstützung bei $.1314,72.


Charttechnischer Ausblick:

Mit dem deutlichen Rücksetzer unter $1.314,72 ist bei Gold aktuell ein kurzfristiges Verkaufssignal aktiv, das zu einem Kurssturz bis $1.265,07 führen dürfte. Dort könnte eine Erholung einsetzen. Würde die Marke im weiteren Verlauf ebenfalls gebrochen, wäre die Erholung beendet und ein Abverkauf bis $1.179,83 die Folge.

Sollte der Goldpreis dagegen direkt über die $1.314,72- Marke zurückfinden, dürfte eine leichte Erholung bis $1.337,90 und ggf. $1.350,00 einsetzen. Bereits dort könnte jedoch ein weiterer Ausverkauf folgen. Erst ein Anstieg über $1.350,00 wäre jetzt bullisch zu werten und würde Folgekäufe bis $1.394,50 nach sich ziehen.

Kursverlauf vom 09.07.2013 bis 02.08.2013 (log. Kerzenchartdarstellung/ 1 Kerze = 1 Stunde)

gs51fb4fc987c3d.gif


Kursverlauf vom 01.05.2013 bis 02.08.2013 (log. Kerzenchartdarstellung/ 1 Kerze = 1 Tag)

gs51fb4fe33697d.gif
 
Gold Survey: Survey Participants See Lower Gold Prices Next Week
Friday August 2, 2013 12:17 PM

(Kitco News) - Weaker gold prices are expected next week, despite the market’s rebound on Friday following a lower-than-expected U.S. jobs report, a majority of participants in the Kitco News Gold Survey said.

In the Kitco News Gold Survey, out of 36 participants, 21 responded this week. Of those 21 participants, six see prices up, while 11 see prices down and four see prices moving sideways or are neutral, meaning 28.6% were bullish, 52.4% bearish and 19% neutral. Market participants include bullion dealers, investment banks, futures traders, money managers and technical-chart analysts.

Last week, 57% of the market participants were bullish. As of noon EDT Friday, prices on the week were down about $10 on the week. As of July 26, survey participants have been correct five weeks in a row.

Those who see weaker prices said the lack of a strong upside trend leaves gold vulnerable to selling. Kevin Grady, owner of Phoenix Futures and Options, said he sees prices weaker next week. “I think the market place is setting up for the Fed announcing tapering in September…. I personally don’t believe they will taper in September, but you can’t trade that way. You have to trade on the perceptions of the marketplace and people are positioning for a September tapering,” he said.

Phillip Streible, senior commodities broker, R.J. O’Brien, said he expects prices to rise next week. “The reaction to the payroll number was a game changer for gold and put it back on the trader screens. We should see gold start trending higher again as the likelihood of the Fed tapering early has diminished,” he said.

The participants who are neutral or see prices moving sideways said thin market conditions could leave prices range-bound.

20130802goldsurvey.JPG
 
Market Nuggets: Triland: Longs, Shorts Stopped Out Of Gold On Day With 'High Body Count'

Friday August 2, 2013 1:21 PM

Gold traders with long and short positions alike were kicked out of the market when stop-loss orders were triggered on a volatile Friday, says Triland Metals. First, gold fell overnight, dropping below $1,300 an ounce for the first time in one and one-half weeks. “On a high-volume day, gold support between $1,305 and $1,310 was broken in early European trading and stop-loss selling ensued until support between $1,280 and $1,285 was found,” Triland says. “Upon release of the U.S. employment report, the market rallied $30.” Gold bounced when a smaller-than-forecast 162,000 rise in July on-farm payrolls left some participants wondering if the Federal Reserve would start tapering quantitative easing in September after all, as many had thought. “Another day of longs and shorts being stopped -- another high body count,” Triland says. “Major support now between $1,280 and $1,285 with resistance between $1,320 and $1,325.” Shortly before the Comex pit close, December gold was $1.50 higher at $1,312.70 an ounce.

By Allen Sykora of Kitco News; asykora@kitco.com


Market Nuggets: Barclays: July ETP Holdings Down For Gold, Palladium; Up for Silver, Platinum

Friday August 2, 2013 11:27 AM

Holdings in global exchange-traded products for gold and palladium fell in July but they rose for silver and platinum, says Barclays. The bank’s initial estimate is that gold ETP redemptions in July were 52 metric tons. “Silver ETP holdings have risen by a sizeable 536 tons in July, according to our preliminary estimates,” the bank says. “Platinum ETPs have continued to scale record highs and are up 58koz in July, while palladium ETPs are down 44koz.”

By Allen Sykora of Kitco News; asykora@kitco.com


Market Nuggets: Barclays: Copper Capital Spending Costs Could Tighten Supply In Future

Friday August 2, 2013 11:26 AM

Global copper production has been rising so far this year, but nevertheless cuts to capital spending likely portends less output down the road than otherwise could have been expected, says Barclays. Chilean data shows mine output there rose 5% year-on-year in the first half of 2013, and operating results from miners around the world who have reported so far show an increase in second-quarter output, Barclays says. “Another trend in the corporate mining results has been continued cutbacks in capital expenditures as part of ongoing cost saving programs,” the bank continues. Barclays later adds: “While the supply effect from these specific decisions will not affect the market balance this year, there is a clear risk that project streamlining will exacerbate the potential fundamental conditions in metals to retighten in the second half of the decade.”

By Allen Sykora of Kitco News; asykora@kitco.com


Market Nuggets: Barclays: Gold Needs Physical Demand To Respond Again

Friday August 2, 2013 11:26 AM

Gold needs physical demand to pick up again, but this may not happen until the seasonally strong period begins in September, says Barclays. Much of recent bounce in prices was buying in the form of short covering, particularly with the Federal Open Market Committee seen as slightly dovish, the bank says. Barclays says an increase in physical demand this year helped offset disinvestment such as outflows from exchange-traded products. Barclays says “further short covering has scope to support prices further, but the key question is whether the buyers across Asia and retail interest can continue to absorb disinvestment. Over the course of this month, in our view, it seems unlikely, given ETP holdings remain fragile and demand in India is unsurprisingly lackluster. Therefore, the short-covering rally will need to plug the gap until buyers return in September.”

By Allen Sykora of Kitco News; asykora@kitco.com
Market Nuggets: Commerzbank: July U.S. Mint Eagle Gold Coin Sales Lowest Of 2013 But Up Year-On-Year

Friday August 2, 2013 9:41 AM

U.S. Mint sales of American Eagle gold coins fell from June to July but are higher than a year ago, says Commerzbank. Mint sales of 50,500 ounces in July were the lowest of any month so far this year and down from 57,000 in June. ”That said, July tends to be a seasonally weak month,” Commerzbank says. “What is more, coin sales were still well above last year’s level.” Mint Eagle coin sales were 30,500 in July 2012. The Mint’s Web site shows that American Buffalo gold-coin sales were 18,500 ounces in July, up from 17,000 in June and 4,000 in July 2012. Meanwhile, American Eagle silver coin sales rose in July to 4,406,500 ounces. This was up from 3,275,000 in June and also up from 2,278,000 in July 2012.

By Allen Sykora of Kitco News; asykora@kitco.com


Market Nuggets: BBH: Soft U.S. Jobs Data Keeps Tapering Thoughts At Bay

Friday August 2, 2013 9:20 AM

The July U.S. jobs data is keeping thoughts about potential Federal Reserve tapering of quantitative easing at bay, says Brown Brothers Harriman. July payrolls rose by a lower-than-forecast 162,000 and the back two months were revised down by a combined 26,000, BBH points out. “The U.S. employment report is disappointing,” BBH says, noting that the workweek and hourly pay also fell. “The Fed's tapering decision does not rest on a single print, especially of high frequency and noisy data, but on the margins, between the FOMC statement that gave no hint of a move in September, a manufacturing PMI that showed prices falling and now a soft employment report, look for some soul searching by those who thought and acted as if reducing long-term asset purchases next month was a done deal.” The U.S. dollar fell on the news, with the euro up to $1.3245 as of 9:13 a.m. EDT from $1.3194 five minutes ahead of the report.

By Allen Sykora of Kitco News; asykora@kitco.com


Market Nuggets: CME Group: July Metals Volume Rises Year-On-Year But Down From June

Friday August 2, 2013 7:54 AM

CME Group metals volume averaged 376,000 contracts per day in July, up 16% from 324,000 in the same month of 2012, the exchange operator reports. Sequentially, however, the July volume was down 14% from an average of 435,000 in June. Meanwhile, the daily average for the three-month period ending in July was 418,000 contracts. This was down from 471,000 for the three months ending in June, 451,000 for the period ending in May and 449,000 for the period ending in April. Total volume for all CME Group products averaged 10.9 million contracts a day in July, up % year-on-year.

By Allen Sykora of Kitco News; asykora@kitco.com


Market Nuggets: A Weaker Jobs Report Shouldn't Weigh Too Much On US Dollar - BNP Paribas

Friday August 2, 2013 7:16 AM

The biggest factor to affect markets on Friday will be the U.S. nonfarm payrolls report. BNP Paribas economists expect a below-consensus forecast of 165,000 jobs created, versus the 185,000 consensus view. “However, we think an outturn in line with our estimate will not be unduly damaging for the U.S. (dollar). Moreover, the risks of a very weak result have been reduced by the strong 200k reading on Wednesday’s ADP report. We are not overly concerned by this week’s FOMC as it still keeps tapering by year end on track (our economists’ view) as long as data improves as we forecast,” they say.
 
Where are the Stops? - Monday, August 5: Gold and Silver

Monday August 05, 2013 09:20

Below are today’s likely price locations of buy and sell stop orders for the active Comex gold and silver futures markets. The asterisks (**) denote the most critical stop order placement level of the day (or likely where the heaviest concentration of stop orders are placed on this day).

See below a detailed explanation of stop orders and why knowing, beforehand, where they are likely located can be beneficial to a trader.

December Gold Buy Stops Sell Stops
$1,320.30 $1,300.00
**$1,325.00 **$1,290.00
$1.339.70 $1,282.40
$1,350.00 $1,275.00

September Silver Buy Stops Sell Stops
$20.00 $19.52
**$20.265 $19.355
$20.595 **$19.185
$21.00 $19.00
 
SILBER UND ROHÖL
Silber: Harter Kampf um 20-Dollar-Marke


Seit vier Wochen pendelt der Silberpreis um die Marke von 20 Dollar. Der seit Oktober 2012 zu beobachtende Abwärtstrend scheint nun in einen Seitwärtstrend überzugehen.

von Jörg Bernhard

Aus charttechnischer Sicht steigt damit die Spannung. Grund: Das Edelmetall versucht derzeit, die obere Trendlinie zu überwinden. Gelingt dies, wäre damit ein Kaufsignal generiert. Positiv wäre auf kurze Sicht auch ein Überwinden der 38-Tage-Linie zu werten. Mittel- wie langfristige Durchschnittslinien machen gegenwärtig aber wenig Mut, da diese sich ganz klar in einer Abschwungphase befinden.
An den Terminmärkten hat der Optimismus ebenfalls signifikant nachgelassen. Der am Freitagabend veröffentlichte COT-Report der CFTC wies einen Rückgang der kumulierten Netto-Long-Position (optimistische Markterwartung) großer und kleiner Spekulanten aus. Dieser reduzierte sich in der Woche zum 30. Juli von 10.113 auf 8.307 Kontrakte (-17,9 Prozent).
Am Montagvormittag präsentierte sich der Silberpreis mit stabilen Notierungen. Bis gegen 7.45 Uhr (MESZ) verteuerte sich der am aktivsten gehandelte Future auf Silber (September) um 0,008 auf 19,92 Dollar pro Feinunze.

Rohöl: Verhaltener Wochenstart

Der Ölpreis startete mit kaum veränderten Notierungen in die neue Handelswoche. Beim Blick auf den Konjunkturkalender gibt es in den USA am Nachmittag vor allem ein Highlight: den ISM-Einkaufsmanagerindex für den Dienstleistungssektor (16.00 Uhr). Im Verarbeitenden Gewerbe gab es am vergangenen Donnerstag eine eindeutig positive Überraschung. Laut einer Bloomberg-Umfrage unter Analysten soll es im Dienstleistungssektor im Juli einen Anstieg von 52,2 auf 53,0 Zähler gegeben haben.
Am Montagvormittag präsentierte sich der Ölpreis mit erholten Notierungen. Bis gegen 7.45 Uhr (MESZ) verteuerte sich der nächstfällige WTI-Kontrakt um 0,33 auf 107,27 Dollar, während sein Pendant auf Brent um 0,29 auf 109,24 Dollar anzog.
 
ROHÖL UND KAFFEE
Rohöl: Gute US-Konjunkturdaten unterstützen


Nach der Bekanntgabe stärker als erwarteter Zahlen zum Einkaufsmanagerindex im Dienstleistungssektor holte der Ölpreis einen Teil seiner zuvor erlittenen Verluste wieder auf.

von Jörg Bernhard

Mit 56,0 Zählern übertraf der Index sowohl den Wert des Vormonats (52,2 Punkte) als auch den Erwartungswert der von Bloomberg befragten Analysten (53,0 Zähler). Weil Libyen seine Exporte wieder aufgenommen hat, reagierten die Marktakteure auf den damit verbundenen Angebotsanstieg aber stärker als auf die aufgehellten Perspektiven der US-Wirtschaft. Morgen soll die Handelsbilanz der USA veröffentlicht werden. Man darf gespannt sein, ob sich die positive Tendenz der US-Wirtschaft fortsetzt. Des Weiteren dürfte auch ein Bericht des US-Arbeitsministeriums über die Anzahl offener Stellen für ein hohes Maß an Aufmerksamkeit sorgen.
Am Montagnachmittag präsentierte sich der Ölpreis mit nachgebenden Notierungen. Bis gegen 17.05 Uhr (MESZ) ermäßigte sich der nächstfällige WTI-Kontrakt um 0,31 auf 106,63 Dollar, während sein Pendant auf Brent um 0,51 auf 108,44 Dollar zurückfiel.

Kaffee: Von Vierjahrestief erholt

In den vergangenen zwei Jahren ging es mit dem Preis für Arabica-Kaffee steil bergab. Von seinem Hoch stürzte er um 60 Prozent ab. Nun gibt es erste Anzeichen für eine Bodenbildung. Zum einen könnte Frost in wichtigen Anbaugebieten Brasiliens zu Ernteeinbußen und damit steigenden Preisen führen. Zum anderen gab die brasilianische Regierung bekannt, dass man die Kaffeefarmer des Landes unterstützen wolle. Außerdem bewegen sich die Lagerreserven nahe am höchsten Stand seit drei Jahren. Aus charttechnischer Sicht sieht die Lage allerdings weiterhin trübe aus. Grund: Der Abwärtstrend ist weiterhin intakt und nach einem Trendwechsel sieht es derzeit wahrlich nicht aus.
Am Montagnachmittag präsentierte sich der ICE-Future auf Kaffee mit erholten Notierungen. Bis gegen 17.05 Uhr (MESZ) verteuerte sich der am nächstfällige Kaffee-Future um 0,50 auf 118,75 US-Cents pro Pfund.
 
05.08.2013 08:00 Uhr | Christian Kämmerer
HUI-Index - Bullen am Ende?

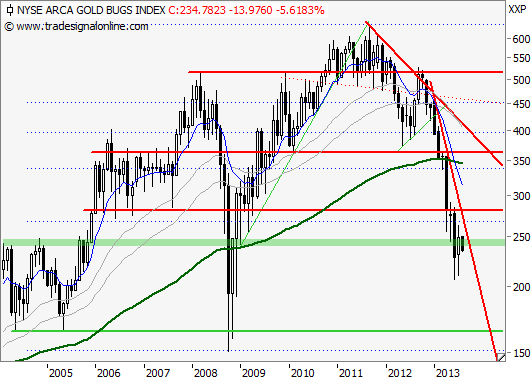
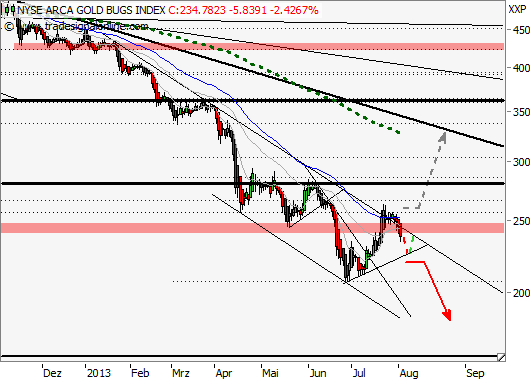
Die Frage der Optionen stellte sich zur vergangenen Analyse vom 15. Juli zum NYSE Arca Gold Bugs Index (HUI-Index). Wie im Chartverlauf ersichtlich, konnten die Bullen die Option anziehende Notierungen geringfügig ausreizen und genau für einen Tag - am 23. Juli - über die Trigger-Marke von 260,00 Punkten ansteigen. Dieses zunächst bullisch wirkende Signal wurde prompt tags drauf wieder relativiert und nun scheinen die Bullen dem Ende wieder nah. Mehr dazu im folgt wie immer an dieser Stelle im Anschluss an den Langfristchart.

gs51ff37901a7a1.png


Quelle Charts: Tradesignal Web Edition


Fazit:

Der Abwärtstrend seit Jahresanfang wurde zwar umringt, doch ein klarer Ausbruch scheiterte eindeutig. Vielmehr erweckt der Index mit der Schwäche zum Ende der letzten Handelswoche den Eindruck, als würden neue Tiefs angesteuert werden können. Die seit dem 26. Juni ausgebildete Aufwärtstrendlinie sollte hierbei genau beobachtet werden. Ein Ausbruch unter diese, mitsamt Notierungen unter 222,00 Punkten, wäre als Bestätigung der Schwäche anzusehen. In der Konsequenz sollte es zur Einstellung des Tiefs vom 26. Juni bei 206,66 Punkten kommen. Ein Bruch dieses Niveaus dürfte rasch die Aufgabe der runden Marke von 200,00 Punkten zur Folge habe.

Weitere Rücksetzer bis 163,81 Punkte sollten dann durchaus eingeplant werden. Um andererseits wieder einen Hoffnungsschimmer zu reaktivieren, wäre ein erneuter Ausbruch über 260,00 Punkte von Nöten. Gelingt dies, sollte man sich durchaus auf einen Zustrom der Käufer freuen. Zugewinne bis 280,00 Punkte wären dabei mindestens zu erwarten, bevor es oberhalb davon zu einem Test des Abwärtstrends aus 2011 bei rund 330,00 Punkten kommen könnte. Interessanterweise verläuft auch in diesem Bereich der gleitenden 200-Tage-Durchschnitt (SMA - aktuell bei 328,08 Punkten) und verleiht dem Niveau um 330,00 Punkte zusätzlichen Charme.

gs51ff379bb8993.png


Quelle Charts: Tradesignal Web Edition


Long Szenario:

Die Abgaben der jüngsten Zeit lasten schwer auf dem Index. Nur ein erneuter Anstieg über 260,00 Punkte dürfte die Bullen zurückführen und eine weitere Aufwärtsbewegung bis 280,00 Punkte begünstigen. Oberhalb davon sollten dann durchaus weiter Zugewinne bis in den Bereich von rund 330,00 Punkten möglich werden, bevor es zu Gewinnmitnahmen kommen dürfte.


Short Szenario:

Kommt es im Zuge weiterer Abgaben zu einem Bruch des kurzfristigen Aufwärtstrends, müssten unmittelbar Rücksetzer bis 206,66 Punkte eingeplant werden. Ein Fall unter 200,00 Punkte dürfte dann nicht lange auf sich warten lassen, was in der Konsequenz zu einer weitere Verlustausdehnung bis 163,81 Punkte führen sollte.
 
Where are the Stops? - Tuesday, August 6: Gold and Silver

Tuesday August 06, 2013 08:47

Below are today’s likely price locations of buy and sell stop orders for the active Comex gold and silver futures markets. The asterisks (**) denote the most critical stop order placement level of the day (or likely where the heaviest concentration of stop orders are placed on this day).

See below a detailed explanation of stop orders and why knowing, beforehand, where they are likely located can be beneficial to a trader.

December Gold Buy Stops Sell Stops
$1,300.00 **$1,282.40
**$1,306.40 $1,275.00
$1.320.30 $1,270.00
$1,325.00 $1,260.00

September Silver Buy Stops Sell Stops
$19.78 $19.52
**$20.00 $19.355
$20.265 **$19.185
$20.595 $19.00
 
Gold to range between US$1,200/oz and US$1,350/oz for now - Morgan Stanley

By Greta Bourke - Monday, August 5, 2013

Morgan Stanley sees gold trading within a range of US$1,200-US$1,350/oz for the foreseeable future."We feel that there is little reason to anticipate a breakout in...
 
HSBC Sees Silver Ranging Between $17-$23/Oz For Rest Of 2013
By Kitco News
Monday August 5, 2013 9:32 AM

(Kitco News) - HSBC looks for silver to trade in a range of $17 to $23 an ounce for the remainder of 2013, with rising supply to constrain rallies but greater jewelry, industrial, coin, bar and Indian import demand to be supportive influences.

The bank upped its average 2013 price forecast to $22.90 an ounce from $21. It left its forecasts for the next two years at $20 and $20.25.

“Silver prices will be determined largely by the interplay between currency levels, monetary and fiscal policies, geopolitics, the price of other precious metals, notably gold, and silver’s underlying supply/demand fundamentals,” HSBC said. “In this regard, there are three drivers that we expect to be important going forward.”

The first is that supply remains strong, the bank said. While prices have fallen this year, they remain above the cost of producing silver for most miners. “It is still worth digging for,” HSBC said. “Scrap supplies are also rising.”

The bank lists total supply of 1.08 billion ounces for 2013, with mine output seen rising to 805 million this year from 787 million last year and silver scrap sales edging up to 260 million from 254 million.

Meanwhile, shifting expectations toward U.S. monetary policy have dented the strength of investment demand, the bank said. The net-long position of Comex speculators fell to historically low levels. Exchange-traded-fund demand remains positive but is flattening.

“We have cut our 2013 forecast for ETF demand growth to 20moz from 50moz, the lowest annual increase on record,” HSBC said. “That the ETFs are up on the year is impressive, but we expect tepid growth to curb rallies.”

HSBC forecast fabrication demand for 2013 of 883 million ounces, up from 847 million last year. Industrial and decorative demand is projected to rise to 482 million ounces from 466 million, while jewelry and silver demand is seen up to 241 million from 231 million. Official coin demand is seen rising to 110 million from 93 million, but photography demand is seen falling to 50 million from 58 million. When adding in the projected ETF demand of 20 million ounces, total demand is listed at 903 million ounces, leaving an expected surplus of 177 million.

In particular, HSBC looks for manufacturers to increase silver consumption based partly on the bank’s macroeconomic forecasts for greater industrial production in key silver-consuming countries. Meanwhile, jewelry demand in India could benefit from the government’s efforts there to restrain gold imports, HSBC said.
 
Slump in recycled gold rebalancing surplus market - Gold Council


(Reuters) - A dramatic drop in the recycling of gold jewellery was helping to rebalance the global bullion market, now in surplus, and could set the stage for a price recovery, the industry-funded World Gold Council said on Tuesday.

The council's managing director of investment, Marcus Grubb, said supplies of gold from recycling would fall by 300 tonnes in 2013, almost a fifth of last year's 1,600 tonnes, as low bullion prices discourage people from cashing in their jewellery.

"Recycling is positively correlated to the gold price," Grubb told Reuters on the side of the Diggers and Dealers mining conference.

"In a bull market recycling rises as the price goes up, on the downside when the price drops, like we saw this year, you see recycling fall because people do not think they will get a good price for their gold," he said.

Grubb said the drop off started in the first quarter when recycling fell four percent as prices sagged and accelerated in April when gold saw its sharpest drop in 30 years.

Strong global economic data has dented gold's safe-haven appeal, physical buying in top consumers India and China remains subdued and traders expect further price falls.

The lion's share of recycled gold comes from India and China, where individuals hold 20,000 and 10,000 tonnes respectively, he said.

The decline in recycling combined with less "new" gold output from mines was helping offset the additional 650 tonnes estimated to enter the market in 2013 as more holdings by exchange traded funds are unwound, according to Grubb.

"What that has done is create a temporary surplus this year," Grubb said. "You need balance to be restored in the gold market in the short term for the longer term drivers of the price to return," he said.

Grubb did not give a timeframe for any recovery in gold prices.
 
GOLD UND ROHÖL

Gold: Wieder unter 1.300 Dollar


Am Montagabend rutschte der Goldpreis wieder unter die Marke von 1.300 Dollar. Erneute ETF-Abflüsse belegten einmal mehr die Verkaufslaune im Markt.

von Jörg Bernhard

So reduzierte sich die gehaltene Goldmenge des weltgrößten Gold-ETF SPDR Gold Shares am gestrigen Montag von 918,64 auf 917,14 Tonnen, das niedrigste Niveau seit Februar 2009. Aus der US-Notenbank Fed kamen zum Wochenstart Hinweise, dass man einem Zurückfahren der Staatsanleihekäufe näher gekommen sei. Dies war von Richard Fisher, dem Präsidenten der Dallas Fed, zu hören. Er gilt seit längerem als Kritiker der ultralockeren Geldpolitik. Seiner Meinung nach führt die aktuelle Geldpolitik zu Fehl-Allokationen an den Finanzmärkten.
Aus charttechnischer Sicht hat sich mit dem Unterschreiten der psychologisch wichtigen Marke von 1.300 Dollar die Lage zudem eingetrübt. Oberste Priorität hat nun das Verteidigen der bei 1.280 Dollar verlaufenden Unterstützungszone. Diese bildete sich in der zweiten Junihälfte und Mitte Juli. Hier dürften zahlreiche Stopps platziert sein, die im Falle eines Verletzens erheblichen Verkaufsdruck generieren könnten.
Am Dienstagvormittag präsentierte sich der Goldpreis mit nachgebenden Notierungen. Bis gegen 7.30 Uhr (MESZ) ermäßigte sich der am aktivsten gehandelte Future auf Gold (Dezember) um 10,20 auf 1.292,20 Dollar pro Feinunze.

Rohöl: Warten auf die Wochenberichte

Mit Spannung warten die Akteure an den Energiemärkten auf die anstehenden Wochenberichte vom American Petroleum Institute (Dienstagabend) und von der US-Energiebehörde EIA (Mittwochnachmittag). Analysten rechnen mit einem erneuten Rückgang der gelagerten Ölmengen. Fällt dieser stärker als erwartet aus, dürfte dies dem Ölpreis helfen, während ihn eine negative Überraschung in tiefere Regionen führen dürfte.
Am Dienstagvormittag präsentierte sich der Ölpreis mit stabilen Notierungen. Bis gegen 7.30 Uhr (MESZ) verteuerte sich der nächstfällige WTI-Kontrakt um 0,06 auf 106,50 Dollar, während sein Pendant auf Brent um 0,15 auf 108,55 Dollar zurückfiel.
 
ENERGIE IM HÖHENFLUG
Öl-Wette: Brent auf Rekordfahrt


Produktionsausfälle und hohe Nachfrage treiben den Preis für Nordseeöl. Mit einem Rohstoffzertifikat lässt sich auf einen weiter steigenden Ölpreis wetten.

Redaktion Euro am Sonntag

Nach dem Jahreshöchststand von etwa 117 US-Dollar für ein Barrel (159 Liter) Öl der Nordsee-Sorte Brent im Februar stürzte der Preis zwei Monate lang ab. Seit Ende Juli klettert die Notierung dank eines schrumpfendes ­Angebots sowie einer steigenden Nachfrage wieder ordentlich nach oben und erreichte zuletzt ein neues Dreimonatshoch. So erwartet die ­Internationale Energieagentur während der Sommermonate überdurchschnittlich starke Produktionsausfälle in der Nordsee durch Wartungs­arbeiten.

„Zwischen Mai und September sollen 330.000 Barrel pro Tag weniger gefördert werden“, sagt Eugen Weinberg, Rohstoffexperte der Commerzbank. Die Ausfälle könnten sogar noch stärker ausfallen als im Jahr zuvor.

Gleichzeitig ist die Nachfrage in Europa im Juli das erste Mal seit zwei Jahren wieder stark angestiegen. Ein Zeichen für ein — wenn auch kleines — wirtschaftliches Comeback des alten Kontinents. Das stützt den Preis des Nordsee-Öls und könnte ihn sogar steigen lassen. Selbst ein neues Jahreshoch scheint nicht ausgeschlossen. Anleger können mit dem endlos laufenden Rohstoffzertifikat ETFS Brent (ISIN: DE 000 A0K RKM 5) auf einen weiteren Ölpreisanstieg setzen. red" target="_blank">Commerzbank. Die Ausfälle könnten sogar noch stärker ausfallen als im Jahr zuvor.
 
ROHÖL UND PALLADIUM

Rohöl: Positive US-Handelsbilanz verpufft


Die am Nachmittag veröffentlichten Daten zur US-Handelsbilanz fielen besser als erwartet aus. Danach ging es mit dem Ölpreis spürbar nach unten.

von Jörg Bernhard

Statt einem erwarteten Handelsbilanzdefizit in Höhe von 43,0 Milliarden Dollar wurde ein Wert von 34,2 Milliarden gemeldet. Dies soll durch steigende Exporte und sinkende Importe verursacht worden sein. Um 16.00 Uhr dürfte wieder einmal der US-Arbeitsmarkt im Fokus der Investoren liegen. Dann steht nämlich die Anzahl offener Stellen zur Bekanntgabe an. Laut einer Bloomberg-Umfrage unter Analysten soll sich diese im Juni von 3,828 Millionen auf 3,850 Millionen leicht verbessert haben. Am Abend erfahren die Akteure an den Energiemärkten vom American Petroleum Institute, wie sich die Öl-Nachfrage und die Lagerreserven auf Wochensicht entwickelt haben.
Am Dienstagnachmittag präsentierte sich der Ölpreis mit nachgebenden Notierungen. Bis gegen 15.30 Uhr (MESZ) ermäßigte sich der nächstfällige WTI-Kontrakt um 0,24 auf 106,32 Dollar, während sein Pendant auf Brent um 0,24 auf 108,46 Dollar zurückfiel.

Palladium: Technischer Rücksetzer

Hedgefonds glauben weiterhin an Palladium. Ihre bullishen Wetten auf das in der Automobilindustrie besonders wichtige Edelmetall bewegen sich auf Rekordniveau. Dies war dem vor dem Wochenende veröffentlichten COT-Report zu entnehmen. Rohstoffexperten von Morgan Stanley und Credit Suisse prognostizieren zudem für die nächsten Jahre Nachfrageüberhänge und eine damit verbundene Angebotsknappheit. Aus charttechnischer Sicht befindet sich das Edelmetall in einer technischen Korrekturphase, nachdem sich Mitte Juli die Widerstände im Bereich von 750 Dollar als zu heftig erwiesen hatten. Nun dürften Charttechniker gespannt in Richtung 710 Dollar blicken, wo sich eine leichte Unterstützungszone gebildet hat.
Am Dienstagnachmittag präsentierte sich der Palladiumpreis mit schwächeren Notierungen. Bis gegen 15.30 Uhr (MESZ) ermäßigte sich der am aktivsten gehandelte Future auf Palladium (September) um 11,60 auf 723,60 Dollar pro Feinunze.
 
Believe It or Not: Gold's 8-Year Cycle Still on Track

Monday August 05, 2013 09:04

Given gold's retreat during 2013, it would seem the Midas Metal's best days are behind it, at least for a while.

But nothing is further from the truth. The strong demand for gold has not gone away.
International investors, central banks and corporations are all looking to buy gold and these low Summer months are likely providing the best price.

Asian investors, especially in China and India, are buying coins and bullion like mad. Sales are up 22% annually in China and 52% in India.

Gold analyst Jim Willie said it best when he said, “The migration of gold from West to East is the grand story of the decade.” They know, as our dear friend Richard Russell recently reminded us, that gold and international power still go hand in hand.

Beyond the obvious demand, history is also on gold's side. Gold's movements are in line with historic trends, never mind what the no-nothing, hand-wringing Cassandra's are saying.

A Unique Moment in History

Never has there been a time in the past when central bank policies so obviously determined market movements. And this past month provided an extreme example.

The ongoing tapering talk pushed gold down sharply because the market believes if the Fed stops stimulating the economy, an inflationary outcome is unlikely, especially if it’s combined with higher interest rates boosting the dollar. All of this is bad for gold.

What's more, there may be darker forces at work as well. There's a distinct possibility the gold market is being manipulated by central bankers - again. The most recent example was a few months ago when Germany demanded the immediate repatriation of its gold, but then it quietly accepted a seven-year delivery plan. There have been too many similar incidents in recent months to pass them off as chance.

Manipulation was blamed on the central bankers back in the 1970s, and it’s still the same. Only this time more central bankers and more powerful groups have joined in as well.

Nothing material really changed to justify a $700 drop in gold prices from over $1903 in 2011 to almost $1200 earlier this month. This 36% fall is clearly the steepest in gold’s 12-year bull market. The worst dip prior to this was an almost 30% decline in 2008.

Gold's 8-Year Cycle: On track

But looking at gold's full bull market rise from 2001 to 2011, gold gained over 660%, so a 36% decline isn’t bad from that perspective.

The fact is, if you got into the bull market early, even up until mid-2010, you’re fine. But if you bought anytime after mid-2010, you are break-even to down.

But even if you’re down, it’s just a matter of time before we see higher gold prices, so it's imperative you keep a core position.

Gold has had a consistent low area nearly every 8 years. You can see below, it’s been pretty reliable by several months. February 2001 saw an 8-year low, following a modest gold rise in 1996. Gold then rose sharply until it fell to the next low in Nov 2008, which was just three months shy of the 8-year mark.

This bring us to today... gold is now almost 5 years closer to the next major 8-year low. This doesn’t mean gold is going down until then. It’s simply saying that 2015 or early 2016 is a likely time period for the next key low in gold.

There are always important major rises in-between the lows. During major bull markets, gold tends to stay above the high reached prior to the 8-year low area. In today’s case, this means gold should stay above the $1000 high of 2008, where the blue horizontal line and the 2001 uptrend meet.
20130805as_image002.png


For now, so far, so good. Gold held above the $1200 level and it’s now showing the first signs of renewed strength by staying above $1275. And since gold is currently rising from an extremely oversold area, there’s a good chance it will break through its next important resistance at $1350.

If so, it’ll be a good sign the decline is over and the price is indeed headed higher.
 
We're In For A Long Bottom – Mining Expert Brent Cook
By Alex Létourneau of Kitco News
Tuesday August 6, 2013 2:00 PM

(Kitco News) - The pain of enormous writedowns from gold seniors is still an open wound for many within the mining sector, and there could be more of it sooner, rather than later says veteran geologist Brent Cook.

In a video interview with Kitco News, Brent Cook, founder of Exploration Insights, said another round of writedowns are looming for seniors, but this time it would be on their resources and reserves.

Cook explained that seniors will “tweak” their mines in this new price environment, where many are producing ounces at a higher cost than the metal is actually worth.

“They’re going to start high-grading their deposits, …what that means is they go after the higher grade mine material and leave the lower grades on the side,” Cook said. “Effectively that sterilizes the rest of the deposit and I think that we’re going to see after these (second quarter) writedowns here (are)writedowns on reserves and resources as they start using a lower gold price to calculate those resources.”

Cook said that companies are going to have to go back and take a look at the gold price they initially used to calculate their reserves and resources. When that happens, he said, “reserves are going to decrease as well, so, we’re going to see a lot of ounces come off the books.”

With the gold plunge of the second quarter, exploration budgets have been all but eradicated Cook said. This could bode well for junior exploration companies in the not too distant future.

“This is setting us up for one or two years in the future for a fantastic run in the juniors, particularly the ones that can survive this period,” Cook said. “I’m convinced that going down the road, all we need to do is own the companies with the highest margin deposits and wait it out because at some point, Barrick, Newcrest, Newmont, Goldcorp, they’re all going to have to go out and buy these deposits and write-off the margins they’re throwing away right now.”

The Rocky Road

As for how long the pain will last for miners, Cook wouldn’t peg it down to a timeframe but feels it could last for awhile.

“My guess is we’re in for a long bottom here. This reminds me of 1997 to the 2001-2002 bottom when we just bounced along, the sector was unloved, there was the occasional discovery,” Cook said. “I think we’ve got a few years of working through this whole mess we’ve got ourselves into until significant money comes back into this sector.”

http://www.kitco.com/news/video/sho...cond-Quarter-Writedowns-Worse-Than-We-Thought
 
P.M. Kitco Metals Roundup: Gold Ends Down, At 3-Wk Low, On Technical Selling, Better U.S. Data, Fed Speak

Tuesday August 6, 2013 2:27 PM

(Kitco News) - Comex gold futures prices ended the U.S. day session solidly lower, hit a three-week low and closed below the key $1,300.00 level. Bearish technical postures for both gold and silver incited more chart-based selling pressure Tuesday. Also, Atlanta Fed president Dennis Lockhart on Tuesday said the Fed could start to taper its monthly bond-buying program at some point yet this year. A sharp decline in the U.S. trade deficit in June also was also a bearish factor for the precious metals, as it suggested a pick-up in U.S. economic conditions. December gold was last down $19.80 at $1,282.60 an ounce. Spot gold was last quoted down $15.00 at $1,289.50. September Comex silver last traded down $0.195 at $19.525 an ounce.

In overnight news, there was more upbeat economic data coming out of the European Union Tuesday. Germany’s manufactured goods orders increased by 3.8% in June versus May. However, European stock markets languished in quiet, summertime trading. Asian stock markets were mostly weaker in dull trading as the world market place awaits fresh macro inputs. The Reserve Bank of Australia cut its main interest rate by 0.25%, to a record low of 2.5% on Tuesday.

With many Europeans and North Americans on summer vacations and with the “dog days” of summer on the doorstep, trading volumes in many markets may dwindle until after the U.S. Labor Day holiday in early September.

The U.S. dollar index was lower Tuesday and is hovering not far above a five-week low. The greenback bears have the overall near-term chart advantage, which is an underlying bullish factor for the precious metals markets. Meantime, Nymex crude oil futures prices were lower Tuesday. However, the crude oil bulls still have the overall near-term technical advantage and that’s also a bullish underlying factor for the metals.

The London P.M. gold fix is $1,280.50 versus the previous P.M. fixing of $1,304.75.

Technically, December gold futures prices closed near the session low and hit a fresh three-week low Tuesday. Bears have the solid overall near-term technical advantage. The gold bulls’ next upside near-term price breakout objective is to produce a close above solid technical resistance at $1,300.00. Bears' next near-term downside breakout price objective is closing prices below solid technical support at $1,250.00. First resistance is seen at $1,290.00 and then at $1,300.00. First support is seen at Tuesday’s low of $1,278.10 and then at $1,275.00. Wyckoff’s Market Rating: 2.0

September silver futures prices closed nearer the session low Tuesday. Bears are in firm near-term technical control. Bulls’ next upside price breakout objective is closing prices above solid technical resistance at the July high of $20.595 an ounce. The next downside price breakout objective for the bears is closing prices below solid technical support at $19.00. First resistance is seen at Tuesday’s high of $19.78 and then at $20.00. Next support is seen at last week’s low of $19.185 and then at $19.00. Wyckoff's Market Rating: 2.0.

September N.Y. copper closed up 90 points at 317.60 cents Tuesday. Prices closed near mid-range. Copper bears have the overall near-term technical advantage. Copper bulls' next upside breakout objective is pushing and closing prices above solid technical resistance at the July high of 323.40 cents. The next downside price breakout objective for the bears is closing prices below solid technical support at last week’s low of 303.65 cents. First resistance is seen at Tuesday’s high of 320.90 cents and then at 323.40 cents. First support is seen at Tuesday’s low of 314.75 cents and then at 312.50 cents. Wyckoff's Market Rating: 3.0.
 
Where Are The Stops? - Wednesday, August 7: Gold And Silver

Wednesday August 07, 2013 09:26

Below are today’s likely price locations of buy and sell stop orders for the active Comex gold and silver futures markets. The asterisks (**) denote the most critical stop order placement level of the day (or likely where the heaviest concentration of stop orders are placed on this day).

See below a detailed explanation of stop orders and why knowing, beforehand, where they are likely located can be beneficial to a trader.

December Gold Buy Stops Sell Stops
$1,284.00 **$1,271.80
**$1,300.00 $1,260.00
$1.306.40 $1,250.00
$1,320.30 $1,240.00

September Silver Buy Stops Sell Stops
$19.50 $19.10
**$19.78 **$19.00
$20.00 $18.75
$20.265 $18.665
 
ROHÖL UND GOLD

Rohöl: Heftiger Absacker verdaut


Der Ölpreis befindet sich weiterhin im Korrekturmodus. Entspannungssignale aus dem Iran waren hierfür maßgeblich verantwortlich.

von Jörg Bernhard

Die gemäßigten Töne vom neuen starken Mann aus dem Iran, Hassan Rouhani, hat die Akteure an den Energiemärkten zu Gewinnmitnahmen veranlasst und den Ölpreis am Dienstag spürbar unter Druck gebracht. Die geopolitische Prämie hat sich dadurch signifikant reduziert. Im Tief fiel die US-Sorte WTI am gestrigen Dienstag auf 104,86 Dollar und die Nordseemarke Brent auf 107,46 Dollar. Am Abend meldete das American Petroleum Institute einen Rückgang der gelagerten Ölmengen um 3,7 Millionen Barrel. Am Nachmittag steht nun der Bericht der US-Energiebehörde EIA (16.30 Uhr) zur Veröffentlichung an. Laut einer Reuters-Umfrage unter Analysten soll sich die gelagerte Ölmenge um 700.000 Barrel reduziert haben.
Am Mittwochvormittag präsentierte sich der Ölpreis mit stabilen Notierungen. Bis gegen 7.00 Uhr (MESZ) ermäßigte sich der nächstfällige WTI-Kontrakt um 0,02 auf 105,28 Dollar, während sein Pendant auf Brent um 0,29 auf 107,89 Dollar zurückfiel.

Gold: Markante Gewinnmitnahmen

Der Goldpreis markierte am gestrigen Dienstag seinen tiefsten Stand seit zweieinhalb Wochen. Die Diskussion um ein möglicherweise bevorstehendes Zurückfahren der monatlichen Staatsanleihekäufe der Fed verunsicherte die Marktakteure und ließ das gelbe Edelmetall abtauchen. Im Bereich von 1.300 Dollar sollen zudem viele Investoren einen Stopp zur Begrenzung potenzieller Kursverluste gesetzt haben. Nachdem diese Marke „fiel“ kam daher erheblicher Verkaufsdruck auf. Im ETF-Sektor machte sich dies ebenfalls bemerkbar. So reduzierte sich zum Beispiel die gehaltene Goldmenge des weltgrößten Gold-ETF SPDR Gold Shares von 917,14 auf 915,04 Tonnen. Die Bereitschaft der Goldminen, auf dem reduzierten Goldpreisniveau ihre Förderung konstant zu halten, dürfte in den kommenden Monaten nachlassen. Ob dies ausreicht, die Goldbaisse zu bremsen, muss allerdings abgewartet werden.
Am Mittwochvormittag präsentierte sich der Goldpreis mit leicht schwächeren Notierungen. Bis gegen 7.00 Uhr (MESZ) ermäßigte sich der am aktivsten gehandelte Future auf Gold (Dezember) um 4,00 auf 1.278,50 Dollar pro Feinunze.
 
ROHÖL UND GOLD

Rohöl: Richtungslos vor EIA-Wochenbericht


Vor der Bekanntgabe des Wochenberichts der US-Energiebehörde EIA bewegt sich der Ölpreis in negativem Terrain.

von Jörg Bernhard

Laut einer Bloomberg-Umfrage unter Analysten soll sich die gelagerte Ölmenge um 1,5 Millionen Barrel reduziert haben. Dies entspräche dem fünften Rückgang innerhalb von sechs Wochen und dem niedrigsten Niveau seit sechs Monaten. Derzeit reagiert der Ölpreis kaum auf positive Einflussfaktoren. Am Vormittag fiel die deutsche Industrieproduktion gegenüber dem Vormonat mit plus 2,4 Prozent (+2,1 Prozent p.a) deutlich höher als erwartet aus – dem fossilen Energieträger war es dennoch egal. Er scheint derzeit nach unten zu streben. Kein Wunder, zog doch die US-Sorte WTI in den vergangenen sieben Wochen in der Spitze um über 17 Prozent an. Dadurch wurde die charttechnische Luft zusehends dünner, so dass der Übergang in den Korrekturmodus keine große Überraschung war.
Am Mittwochnachmittag präsentierte sich der Ölpreis mit nachgebenden Notierungen. Bis gegen 15.45 Uhr (MESZ) ermäßigte sich der nächstfällige WTI-Kontrakt um 0,14 auf 105,16 Dollar, während sein Pendant auf Brent um 0,43 auf 107,75 Dollar zurückfiel.

Gold: Umsätze trocknen aus

Im Hochsommer lässt das Interesse am Goldhandel häufig nach – so auch in diesem Jahr. Dadurch wird das gelbe Edelmetall besonders anfällig für Preismanipulationen. Aus charttechnischer Sicht besteht nach dem Rutsch unter die Marke von 1.300 Dollar weiterhin Rückschlagpotenzial. US-Notenbanker liefern derzeit auch wenig Argumente zum Kauf. Am gestrigen Dienstag stellte mit Charles Evans – dem Präsidenten der Chicago Fed – zum dritten Mal innerhalb von zwei Tagen ein US-Notenbanker ein baldiges Zurückfahren der Fed-Staatsanleihekäufe in Aussicht. Auf solche Statements reagieren die Akteure an den Goldmärkten meist mit verstärkten Abgaben. Aus charttechnischer Sicht ist das gelbe Edelmetall derzeit besonders gefährdet, da es sich in einer markanten Unterstützungszone bewegt.
Am Mittwochnachmittag präsentierte sich der Goldpreis mit stabilen Notierungen. Bis gegen 15.45 Uhr (MESZ) verteuerte sich der am aktivsten gehandelte Future auf Gold (Dezember) um 0,70 auf 1.283,20 Dollar pro Feinunze
 
"Hello HSBC, This Is JPMorgan - We Urgently Need Some Of Your Gold" :D :lol:

Submitted by Tyler Durden on 08/07/2013 18:21 -0400


What happens when 63.5K ounces of registered gold in your warehouse (16% of total) just has their warrants detached and the vault is about to finds itself 63.5k ounces of gold emptier? If you are JPM you call the gold vault with most inventory in town, that of HSBC, and politely request that they transfer as much eligible gold as they can on short notice - in this case a tiny 6,444.936 oz to be exact.

None of which changes the fact that in a few days, the inventory in JPM's gold vault will drop to another record low of only 380K ounces and the JPM "rescue" pleas from HSBC and other Comex members will become ever louder and more desperate until one day they may just go straight to voicemail.

HSBC%20to%20JPM_0.jpg
 
Where are the Stops? - Thursday, August 8: Gold and Silver

Thursday August 08, 2013 08:43

Below are today’s likely price locations of buy and sell stop orders for the active Comex gold and silver futures markets. The asterisks (**) denote the most critical stop order placement level of the day (or likely where the heaviest concentration of stop orders are placed on this day).

See below a detailed explanation of stop orders and why knowing, beforehand, where they are likely located can be beneficial to a trader.

December Gold Buy Stops Sell Stops
**$1,300.00 $1,282.00
$1,306.40 **$1,271.80
$1.320.30 $1,260.00
$1,325.00 $1,250.00

September Silver Buy Stops Sell Stops
$20.085 $19.455
**$20.265 **$19.10
$20.595 $19.00
$20.75 $18.665
 
Status
Für weitere Antworten geschlossen.
Oben Unten