Rohstoffthread (Archiv)

Status
Für weitere Antworten geschlossen.
GOLD UND ROHÖL
Rohöl: WTI "knackt" 100-Dollar-Marke


Die Erholungstendenz an den internationalen Aktienmärkten hat auch dem fossilen Energieträger in höhere Preisregionen verholfen.

von Jörg Bernhard

Nun warten die Akteure an den Energiemärkten auf den Wochenbericht der US-Energiebehörde EIA (15.30 Uhr) sowie das Ergebnis der Fed-Sitzung (ab 19.00 Uhr). Derzeit kann man dem Ölpreis ein gewisses Maß an relativer Stärke attestieren. Da die geopolitischen Spannungen zuletzt eher abgenommen haben, wäre ein technischer Rücksetzer durchaus nachvollziehbar gewesen. So richtig vom Tisch sollte die Sorge um die europäische Energieversorgung damit allerdings dennoch nicht sein. Die gegenüber dem Jahreswechsel deutlich erhöhte Volatilität dürfte daher weiterhin anhalten.
Am Mittwochnachmittag präsentierte sich der Ölpreis mit uneinheitlichen Notierungen. Bis gegen 14.55 Uhr (MEZ) verteuerte sich der nächstfällige WTI-Kontrakt (April) um 0,41 auf 100,11 Dollar, während sein Pendant auf Brent (Mai) um 0,60 auf 105,91 Dollar zurückfiel.

Gold: Talfahrt geht weiter

Das gelbe Edelmetall weist mittlerweile den dritten Handelstag in Folge negative Vorzeichen auf. Aus charttechnischer Sicht wächst damit die Spannung, da im aktuellen Kursbereich die untere Begrenzung des seit Anfang des Jahres eingeschlagenen Aufwärtstrends verläuft. Und auch unter fundamentalen Aspekten wächst die Spannung. Grund: Am Abend dürfte die Finanzwelt besonders aufmerksam den Ausgang der Fed-Sitzung mit anschließender Pressekonferenz verfolgen. Da die Flucht ins Gold - bedingt durch die Ukraine-Krise - wieder am Abklingen ist, fragen sich die Investoren nun, wie es wohl mit den Staatsanleihekäufen der Fed weitergeht. Der Analystenkonsens rechnet hier mit einer weiteren Reduktion auf "nur noch" 55 Milliarden Dollar pro Monat.
Am Mittwochnachmittag präsentierte sich der Goldpreis mit fallenden Notierungen. Bis gegen 14.55 Uhr (MEZ) ermäßigte sich der am aktivsten gehandelte Future auf Gold (April) um 14,40 auf 1.344,60 Dollar pro Feinunze.
 
What's Driving Gold: Infographic
By Kitco News
Wednesday March 19, 2014 10:38 PM

(Kitco News) - With markets waiting for the Federal Reserve to release its monetary policy decision, Frank Holmes, CEO and chief investment officer of U.S. Global investors shows how inflation and real low-to-negative interest rates are driving gold prices.

How-Real-Interest-Rates-Drive-Gold-infographic-03132014.gif


Read Frank Holmes’ full commentary http://www.kitco.com/ind/Holmes/2014-03-19-Feelin-the-Fire-Investors-are-Hot-for-Gold.html
 
Global Investors Take More Defensive Stance As Geopolitical Risks Increase - BAML Fund Managers’ Survey
By Kitco News
Wednesday March 19, 2014 12:06 PM

(Kitco News) - Global investors are taking a more defensive stance in their portfolios as geopolitical tensions remains the biggest threat to financial markets, according to a survey from Bank of America Merrill Lynch.

On Tuesday, BAML released the results of its fund managers’ survey and reported that 81% of investors surveyed said that they see the tensions in Ukraine as a threat to the stability of financial markets, a four-fold increase compared to last month’s survey. At the same time, 27% of investors see, in general, a geopolitical crisis as the biggest risk to markets, up from 12% in February.

In the report, the analysts at the bank said that this change in market sentiment could have an impact on equity markets as investors take more risk-adverse positions.

“We see signs that recent exuberance in sentiment and positioning in Europe is waning. While Europe's recovery remains in play, markets likely need to consolidate further before resuming their upward trend,” said John Bilton, European investment strategist, in the report.

According to the survey, a net 16% of global asset allocators said they are overweight in cash, up from the previous month’s reading of 12%. At the same time, demand for protection against sharp falls in equity markets has increased to its highest level in 22 months.

With no new information, tensions among Ukraine, Western nations and Russia have started to wane; however, that is only part of the picture. Along with the uncertainty over the Crimean region, analysts at BAML said that investors are starting to fear more economic weakness in China.
“A net 47% of regional fund managers in Japan, Asia Pacific and global emerging markets expect China's economy to weaken in the coming year, up from a net 41% a month ago,” the report said.
 
South African Mines Too Deep, Root Of The Platinum Strikes Issue
By Alex Létourneau of Kitco News
Wednesday March 19, 2014 12:30 PM

(Kitco News) - Mining strikes between South Africa’s platinum giants and workers is fast approaching two months and there appears to be little movement from either side towards a resolution.

Bruce Shapiro, president of MineAfrica Inc. and Edward Sterck, vice president, research analyst at BMO Capital Markets, both see the current state of the actual mines as a key issue.

“What I think is really at the root of the problem is the structure of the existing platinum mines,” said Shapiro. “They’re very deep, they’re very difficult to work, very labor intensive and very costly.”

“That’s really the problem they’re really all wrestling - it doesn’t necessarily make sense to progress some of these projects,” said Sterck. “In a way you’d be better off curtailing higher cost production and trying to benefit from your lower cost operations from improvements in U.S. dollar and PGM prices, assuming that the production that comes off the table is enough to stimulate a price response.”

The strike began Jan 23 when the Association of Mineworkers and Construction Union (AMCU) downed tools at Anglo American Platinum Ltd. (JSE:AMS), Impala Platinum Holdings Ltd. (JSE:IMP)(LSE:IPLA) and Lonmin plc (JSE:LOLMI)(LSE:LMI) mines in South Africa.

At the center of the issue are wages, with the AMCU demanding higher pay and the platinum companies stating the demands are too high.

Essentially, workers are looking for more money as they need to work a few kilometers underground, while the mining companies are already seeing high costs from mining so deep in the ground.

Shapiro said that mining at excessive depth will eventually be replaced.

“I think what you’re going to see is a new breed of platinum mine coming on-stream that can be highly mechanized and are not as deep,” he said.

Two companies he highlighted with this ability are Platinum Group Metals Ltd. (TSX:PTM)(NYSE MKT:PLG), with its Waterberg discovery, and Ivanhoe Mines’(TSX:TRQ) Platreef project – both located in South Africa.

While mechanized mining may be the future, at the moment South Africa boasts a labor force that is not quite as skilled as other countries. This raises issues when a company may no longer be able to afford running a mine at the current platinum prices. Spot platinum was last quoted down $5.00 at $1447.00 an ounce.

“One can understand how the government is keen on employment when, on average, each of these miners supports ten extended family members and so you’ve got no real social support in South Africa,” said Sterck.

“The flip side of that, of course, is for the companies out there, it’s very difficult for them politically to close down loss-making operations.

“The longer the strike goes on, the more distressed the situation the companies are likely to end up in, so the harder it’s going to be for them to restart some of the more expensive operations,” he added.

This all leads to the question, how will this affect platinum supply?

At the end of 2013, banks and firms all listed that platinum supply would be in deficit for 2014, it was just a matter of by how much. Not taken into account of course was the lost supply from the strike, which Reuters pegged yesterday at roughly 10,000 ounces per day for a total of 440,000 ounces per day.

According to Sterck, there will be possibility of a supply issue if the strike isn’t resolved shortly, especially on the industrial side.

“At the moment it’s difficult to say for certain, and the reason is the producers have continued to meet their contractual commitments from inventory,” Sterck said. “This is a fairly broad-brush statement, but those inventories are largely expected to be depleted at some point during March, and we’re getting quite close to the end of that right now.

“So thereafter, I would expect there to be a price response - it’s been pretty quiet so far, considering how long the strike has gone on for,” he added. “Even if we have a resolution tomorrow and production starts next week, it’s fair to say there will be an interruption to supply in order to rebuild those pipeline inventories that have been drawn down.”
 
BBH: FOMC Sounded ‘More Hawkish Than Expected’

Thursday March 20, 2014 8:33 AM

Markets construed the Federal Open Market Committee to be “more hawkish than expected” Wednesday despite new Chair Janet Yellen’s emphasis that there was no change in policy intentions, says Brown Brothers Harriman. “The market focused on two elements,” BBH says. “First, Fed funds at the end of next year are now seen at 1.0% (based on forecasts from Fed officials), up from 0.75% in December 2013, when the last projections were made. Just as importantly, at the end of 2016, Fed funds are seen 2.25%, up from 1.75%.” Meanwhile, the FOMC says that there would be a "considerable period" between the end of asset purchases and the first increase in rates. “However, when pressed, Yellen opined that a ‘considerable period’ could be around six months,” BBH says. “Participants quickly did the math. It anticipates the FOMC completing the asset purchases in October. Yellen's clarification/expansion points to a hike as early as Q2 15. It would not be surprising if in subsequent commentary, the Fed's leadership tries to backtrack from those implications.” Still, BBH adds, “it may be hard to put the proverbial toothpaste back in the tube, especially if the economic data bounces back as the weather impact fades. Moreover, there may be more lasting damage to the Fed's credibility.”

By Allen Sykora of Kitco News; asykora@kitco.com


Citi: Precious-Metals ETFs Experience Strong Net Inflows

Thursday March 20, 2014 8:18 AM

Strong net inflows into precious-metals exchange-traded funds occurred during the first half of March, says Citi Research. The bank says global gold ETF holdings rose by 18.6 metric tons, or 1.2%, between Feb. 28 and March 14 to 1,610 tons. Platinum ETFs had net inflows of 1.4 tons, or 2%, to 71.7 tons during this period. Citi reports a 0.7-ton net inflow, or 1.2% increase, for palladium ETFs. Silver ETF holdings rose by 139 tons, or 0.8%.

http://www.kitco.com/news/2014-03-20/KitcoNewsMarketNuggets-March-20.html
 
A.M. Kitco Metals Roundup: Gold Solidly Lower, At 3-Week Low, As Bulls Losing Technical Control

Thursday March 20, 2014 8:06 AM

(Kitco News) - Gold prices are solidly lower and hit a three-week low in early trading Thursday, on follow-through selling pressure from strong losses suffered Wednesday. A rebound in the U.S. dollar index the past 24 hours and the latest FOMC news are helping to pressure the precious metals markets. Gold market bulls are quickly losing the near-term technical advantage they had enjoyed for several weeks. April gold was last down $17.80 at $1,323.60 an ounce. Spot gold was last quoted down $6.70 at $1,324.40. May Comex silver last traded down $0.621 at $20.215 an ounce.

The market place is still digesting the statement of the latest U.S. Federal Reserve Open Market Committee (FOMC) meeting that ended Wednesday afternoon, and Fed Chair Janet Yellen’s press conference afterward. As expected, the FOMC will continue on its “tapering” program, whereby monthly bond purchases are whittled down by $10 billion a month. What rattled some markets, including gold, was an indication the Fed could begin to raise U.S. interest rates sooner than many expect—sometime in 2015. Yellen is perceived to be fully in the dovish camp on monetary policy, and several markets were caught off guard by the FOMC statement and her remarks that were deemed less-than-fully-dovish.

The U.S. dollar index has surged following the FOMC developments, which in turn has been a bearish underlying factor for commodity markets, including gold. U.S. Treasury market prices have also slumped (yields rising).

Asian and European stock markets sold off Thursday, following the lead of U.S. stock indexes Wednesday, in the wake of the FOMC statement and Yellen press conference.

The Ukraine-Russia matter has moved from an international crisis to a regional squabble, from the perspective of the market place. Gold is no longer drawing a safe-haven bid from this situation. German President Angela Merkel on Thursday called the Group of Eight (G-8) nations defunct—basically kicking Russia out of the club of the eight most economically powerful nations in the world. Any significant escalation of tensions between Ukraine and Russia would quickly put keen risk-aversion back into the market place.

U.S. economic data due for release Thursday includes the weekly jobless claims report, existing home sales, leading economic indicators, and the Philadelphia Fed business survey.

Wyckoff’s Daily Risk Rating: 5.0 (The Ukraine situation has for the moment de-escalated and has become a non-factor.)

(Wyckoff’s Daily Risk Rating is your way to quickly gauge investor risk appetite in the world market place each day. Each day I assess the “risk-on” or “risk-off” trader mentality in the market place with a numerical reading of 1 to 10, with 1 being least risk-averse (most risk-on) and 10 being the most risk-averse (risk-off), and 5 being neutral.

The London A.M. gold fix is $1,327.00 versus the P.M. fixing of $1,338.00.

Technically, April gold futures have seen a 2.5-month-old uptrend on the daily bar chart at least temporarily negated with this week’s downside price action. The gold bulls have lost their near-term technical advantage. Bulls’ next upside near-term price breakout objective is to produce a close above technical resistance at $1,360.00. Bears' next near-term downside breakout price objective is closing prices below technical support at $1,300.00. First resistance is seen at the overnight high of $1,335.30 and then at $1,340.00. First support is seen at the overnight low of $1,321.30 and then at $1,310.00.

May silver futures bears have the near-term technical advantage as prices Thursday hit a fresh six-week low. A four-week-old downtrend is in place on the daily bar chart. Silver bulls’ next upside price breakout objective is closing prices above solid technical resistance at $21.50 an ounce. The next downside price breakout objective for the bears is closing prices below solid technical support at $20.00. First resistance is seen at $20.50 and then at the overnight high of $20.73. Next support is seen at $20.00 and then at $19.75.
 
Fear Premium Has Been Sold

Thursday March 20, 2014 08:23

The selling accelerated again overnight, as the $1,337 level was breached, after Yellen’s comments that tapering would continue and the Ukraine situation fades from memory. The damage “looks” dynamic, but technically the markets are still constructive. However, the $1,317 level needs to hold today or traders will set their sights on the critical 200-day moving average, now around the $1,306 level. The primary catalyst for the continued selling is the significant appreciation of the U.S. dollar overnight, with the Euro down some 150 points and resource currencies, such as the Canadian dollar, down 200 points in two trading days. Most of the selling, for this week, is probably behind us and I suspect some consolidation here into the weekend. Traders that sold the news on Monday may want to consider taking some off the table.
 
Where are the Stops? Thursday, March 20: Gold and Silver

Thursday March 20, 2014 08:24

Below are today's likely price locations of buy and sell stop orders for the active Comex gold and silver futures markets. The asterisks (**) denote the most critical stop order placement level of the day (or likely where the heaviest concentration of stop orders are placed on this day).

See below a detailed explanation of stop orders and why knowing, beforehand, where they are likely located can be beneficial to a trader.

April Gold Buy Stops Sell Stops
$1,325.00 $1,320.00
$1,335.30 $1,310.00
$1,340.00 **$1,300.00
**$1,350.00 $1,290.00
May Silver Buy Stops Sell Stops
$20.50 **$20.00
**$20.73 $19.75
$21.00 $19.50
$21.25 $19.25
 
19.03.2014 07:00 | Adam Hamilton
Große Goldfutures-Käufe

Der starke Anstieg von Gold infolge eines Abprallens wird durch große Goldfutures-Käufe angetrieben. Nachdem sie Gold im letzten Jahr verstoßen hatten, kehren US-amerikanische Futures-Spekulanten nun wieder in Scharen zu dem gelben Metall zurück. Diese Kapitalzuflüsse sind ein sehr bullisches Vorzeichen, denn bedeutende Futures-Käufe sind die treibende Kraft für junge Goldanstiege, bevor Investoren zurückkehren und das Steuer in die Hand nehmen. Und diese großen Goldfutures-Käufe sind wahrscheinlich erst im Anfangsstadium!

Rein vom fundamentalen Angebot- und Nachfragestandpunt aus, sind die zerstörerischen Verluste von Gold im letzten Jahr nur auf rekordartige Gold-ETF-Verkäufe der Aktientrader zurückzuführen. Die umfassenden Daten des World Gold Council für 2013 zeigen, dass die globalen Gold-ETF-Abflüsse durch die unglaublichen Anteilsverkäufe sogar um ein Drittel größer waren als der weltweite Gesamtrückgang in der Goldnachfrage! Ohne diese extremen Gold-ETF-Liquidationen wäre Gold nicht abgestürzt.

Glücklicherweise kaufen Aktientrader langsam wieder Gold-ETF-Anteile, was zum ersten Mal seit über einem Jahr zu Kapitalzuflüssen von den Aktienmärkten zu Gold führt. Diese entscheidende Rückkehr zum Mittelwert beim Investoreninteresse für Gold hat gerade erst begonnen. Bislang hat der führenden US-amerikanische Gold-ETF GLD lediglich 1/25 seiner Edelmetallbestände zurück, die in den 13 Monaten bis Januar ausgeblutet sind! Investoren treiben die neue Erholung dieser Gold-ETF-Bestände an.

Doch ein weiterer Faktor für die schlimmsten Goldverluste in einem Drittel eines Jahrhunderts waren rekordartige Futures-Verkäufeim letzten Jahr. In der ersten Hälfte 2013 stießen US-amerikanische Futures-Spekulanten Gold in anhaltend extrem großen Umfang ab. Interessanterweise stabilisierte sich der Goldpreis, als diese ausufernden Verkäufe Mitte des Jahres ihren Höhepunkt erreichten, obwohl die enormen Gold-ETF-Liquidationen anhielten. Der Futures-Handel dominiert die Goldkursbewegung!

Dafür gibt es mehrere Gründe. Auch wenn Gold weltweit in physischer Form gehandelt wird, variiert der tatsächliche Preis leicht. Der US-amerikanische Goldfutures-Markt bietet eine zentralisierte Kursnotierung, an der sich die anderen Märkte orientieren können. Das tatsächliche physische Gold ist kostspielig und umständlich zu handeln, aber Futuresbieten eine sofortige Hebelwirkung des Goldpreisesfür Hedger und Spekulanten. Und Goldfutures gibt es seit Jahrzehnten

US-amerikanische Goldfutures werden seit Ende 1974 gehandelt, als der Besitz von Gold endlich wieder für US-Amerikaner legal wurde, nachdem er vier Jahrzehnte lang von einem demokratischen Präsidenten verboten worden war. Den GLD hingegen gab es nicht bis Ende 2004, drei Jahrzehnte nach dem Beginn des US-amerikanischen Goldfutures-Handel. In Hinblick auf einen Echtzeit-Kurs und Händlerstimmung bleiben US-amerikanische Goldfuturesalso das einzig Wahre. Sie sind der Goldpreis.

Daher sorgen die starken Goldfutures-Käufe in diesem Jahr ebenso für einen Aufwärtstrend, wie die extremen Goldfutures-Verkäufe den Goldpreis in der ersten Hälfte 2013 zerstörten. Die Folgen dieses entscheidenden Wandels sind sehr bullisch. Orientiert man sich an einem mehrjährigen Durchschnitt, ist bestenfalls die Hälfte dieser Goldfutures-Käufe abgeschlossen. Während Futures-Käufe Gold immer höher befördern, werden mehr und mehr Investoren zurückgelockt, was den neuen Goldaufschwung stärken und verstärken wird.

Dabei darf unter keinen Umständen vergessen werden, dass Futures ein Nullsummenspiel sind. Jeder Futures-Kontrakt besitzt einen Trader auf der Long-Seite und einen anderen auf der Short-Seite. Der erstere setzt darauf, dass der zugrundeliegende Kurs steigt und der letztere darauf, dass der Kurs fällt. Jeder Dollar-Gewinn des Gewinners ist ein direkter Dollar-Verlust des Verlierers. Infolge dieser Grundstruktur ist die Anzahl der ausstehenden Long- und Short-Goldfutures immer genau gleich.

Aber es gibt zwei unterschiedliche Gruppen von Futures-Händlern, Hedger und Spekulanten. Hedger produzieren oder konsumieren tatsächlich den zugrundeliegende Rohstoff, sie benutzen Futures also einfach zur Absicherung ihrer zukünftigen Kauf- und Verkaufspreise, um dadurch die Marktrisiken für ihre Geschäfte zu minimieren. Aber Spekulanten handelnFutures nur auf der Jagd nach Gewinnen, sie haben kein Interesse am tatsächlichen Handel mit Gold. Ihre äußerst wechselhaften Käufe und Verkäufe beeinflussen den Goldkurs.

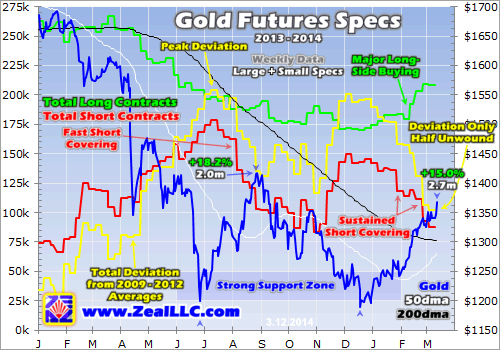
Jede Woche veröffentlicht die wichtigste US-amerikanische Futures-Regulierungsbehörde einen großartigen Bericht, den Commitmentsof Traders Bericht, der die Futures-Positionen von Hedgern und Spekulanten aufführt. Die Grafiken in diesem Artikel wurden mit Hilfe der CoT-Daten erstellt und zeigen, wie US-amerikanische Futures-Spekulanten auf Gold wetten. Und sie haben aggressiv gekauft, weshalb der Goldpreis in den letzten Monaten so schön gestiegen ist.

gs5328f25bc5581.gif


Diese Grafik mag komplex erscheinen, aber sie ist ziemlich einfach. Die grüne Linie zeigt auf Wochenbasis die Anzahl von Goldkontrakten, die US-amerikanische Futures-Spekulanten auf der Long-Seite halten. Dies sind Wetten mit einer Hebelwirkung darauf, dass der Goldpreis steigen wird, je höher also dieser Wert ist, umso optimistischer sind die Händler insgesamt gegenüber Gold. Und die rote Linie zeigt ihre Wetten auf der Short-Seite, wobei höhere Werte hier bedeuten, dass sie als Gruppe pessimistischer sind.

http://goldseiten.de/artikel/200523--Grosse-Goldfutures-Kaeufe.html?seite=2
 
20.03.2014 07:00 | Eugen Weinberg
Gold mit überraschend starkem Jahresauftakt

Der Goldpreis ist Mitte März auf ein 6-Monatshoch von knapp 1.400 USD je Feinunze gestiegen. Schlüssel hierfür war eine Trendwende bei den ETF-Verkäufen. Der Preisanstieg war teilweise aber auch spekulativ getrieben. Der Goldpreis dürfte daher vorübergehend nochmals nachgeben, wenn die Unterstützung durch die Krim-Krise nachlässt und die Realzinsen aufgrund besserer US-Daten wieder steigen. Das Ende der ETF-Verkäufe und die robuste Nachfrage aus Asien sprechen danach für eine Fortsetzung des Aufwärtstrends und ein Preisniveau von 1.400 USD je Feinunze zum Jahresende. Silber sollte begünstigt durch eine Belebung der Industrienachfrage seine Unterbewertung gegenüber Gold abbauen und auf 24 USD je Feinunze steigen.

Der Goldpreis setzt seine im Januar begonnene Erholung bis zuletzt fort. Seit Jahresbeginn hat sich Gold in US-Dollar gerechnet um fast 15% verteuert. Mitte März erreichte der Preis mit 1.392 USD je Feinunze ein 6-Monatshoch (Grafik 1). Die Stärke von Gold ist nicht nur auf den schwachen US-Dollar zurückzuführen, welcher gegenüber dem Euro auf den tiefsten Stand seit Oktober 2011 gefallen ist. Auch der Goldpreis in Euro liegt seit Jahresbeginn fast 14% im Plus und erreichte mit 1.000 EUR je Feinunze ebenfalls das höchste Niveau seit sechs Monaten.

Wir gingen zwar im Gegensatz zu vielen anderen Markbeobachtern in unserem Jahresausblick davon aus, dass der Goldpreis im Verlauf des Jahres 2014 steigen wird. Allerdings sind auch wir ob des frühen Zeitpunkts und des Ausmaßes der Aufwärtsbewegung überrascht worden. Dazuhaben sicher auch Sonderfaktoren wie die zwischenzeitlichen Unruhen und Währungsturbulenzen in einigen Schwellenländern beigetragen. Hinzu kamen zuletzt die Spannungen zwischen Russland und der Ukraine und die drohende Eskalation des Konflikts auf der Halbinsel Krim. Dadurch war Gold als sicherer Hafen stärker gefragt.

Wichtiger für den Preisanstieg ist aber die Erholung der Investmentnachfrage im Westen. Als Schlüssel hierfür erachteten wir im Jahresausblick eine Trendwende bei den ETF-Abflüssen. Letztere ist inzwischen eingetreten. Nachdem im Januar noch 24 Tonnen Gold aus den ETFs abgezogen wurden, wurden diese Abflüsse seither nahezu vollständig rückgängig gemacht (Grafik 2).

Der weltgrößte Gold-ETF, SPDR Gold Trust, verzeichnet seit Jahresbeginn inzwischen sogar Netto-Zuflüsse von 15 Tonnen. Das Ende der ETF-Verkäufe bedeutet für den Goldpreis eine massive Entlastung. Um dies zu verdeutlichen, lohnt ein Blick auf die Statistik des World Gold Council. Die ETF-Abflüsse von insgesamt 881 Tonnen waren dafür verantwortlich, dass die gesamte Goldnachfrage im letzten Jahr um 15% auf ein 4-Jahrestief von 3.756,1 Tonnen fiel. Ohne die ETF-Abflüsse hätte die Goldnachfrage 2013 dagegen ein Rekordhoch erreicht. Denn die Nachfrage nach Goldschmuck markierte mit 2.209,5 Tonnen ein 5-Jahreshoch und die Nachfrage nach Münzen und Barren mit 1.654 Tonnen ein Allzeithoch.

56704.png


Die Stimmungswende bei den ETF-Investoren hängt mit mehreren Faktoren zusammen. Wichtig war, dass Ende Dezember das 3-Jahrestief von Ende Juni bei 1.180 USD je Feinunze gehalten hat. Dadurch wurde der Boden beim Goldpreis bestätigt und der Verkaufsdruck eingedämmt. Zweiter wichtiger Grund ist das (vorläufige) Ende des Höhenfluges an den Aktienmärkten. Zwar erreichte der S&P 500 Anfang März ein neues Rekordhoch, liegt seit Jahresbeginn aber nur leicht im Plus.

Der DAX konnte das im Januar markierte Allzeithoch seither nicht wieder erreichen und handelte Mitte März sogar 5% niedriger als zu Jahresbeginn. Dazu kam es an den Aktienmärkten aufgrund der Währungsturbulenzen in den Schwellenländern und der Krim-Krise zwischenzeitlich zu heftigen Schwankungen. Gold erhält durch die weniger euphorische und deutlich volatilere Entwicklung an den Aktienmärkten Rückenwind. Denn die Umschichtungen von Gold in Aktien, welche im letzten Jahr wesentlich zu den ETF-Abflüssen beigetragen hatten, sind dadurch abgeebbt.

Dritter wesentlicher Grund ist der deutliche Rückgang der Realzinsen seit Jahresbeginn. Die höhere Risikoaversion an den Finanzmärkten und die vor allem wetterbedingt schwächeren Konjunkturdaten aus den USA haben die Rendite für 10-jährige US-Staatsanleihen in diesem Jahr um bis zu 40 Basispunkte auf 2,6% fallen lassen. Gleichzeitig war die US-Inflationsrate im Januar leicht gestiegen. Ende Januar lag der Realzins nur noch bei etwas mehr als 1% und war damit so niedrig wie zuletzt im August 2013.

Allerdings dürften die Realzinsen wieder steigen, wenn sich die US-Daten im Frühjahr nach dem Ende desextrem kalten Winters verbessern. Einen so kräftigen Anstieg der Realzinsen wie im Vorjahr erwarten wir jedoch nicht. 2013 stiegen die Realzinsen aufgrund steigender Nominalzinsen und einer fallenden Inflationsrate von 0% auf 1,8%, was für die Goldnachfrage im Jahr 2013 einen erheblichen Belastungsfaktor darstellte (Grafik 3).

Eine deutliche Stimmungsaufhellung lässt sich auch bei den kurzfristig orientierten Finanzanlegern beobachten. Diese setzen wieder verstärkt auf einen steigenden Goldpreis. Der Saldo aus spekulativen Long- und Short-Positionen ist seit Ende Dezember in zehn von elf Wochen gestiegen. Mitte März erreichten die Netto-Long-Positionen mit 106 Tsd. Kontrakten das höchste Niveau seit Dezember 2012 (Grafik 4).

Zwischen Ende Dezember und Mitte März sind auf diese Weise per Saldo umgerechnet 294 Tonnen Papier-Gold in den Futuresmarkt geflossen. Damit haben auch die spekulativen Finanzanleger maßgeblich zum Preisanstieg in den letzten Wochen beigetragen. Gleichzeitig hat sich dadurch aber auch Korrekturpotenzial gebildet.

Die robuste Nachfrage aus Asien sollte auch 2014 ein wichtiger unterstützender Faktor für den Goldpreis bleiben. Laut World Gold Council fragten China und Indien im letzten Jahr zusammengenommen über 2.000 Tonnen Gold nach und stellten damit mehr als 50% der weltweiten Goldnachfrage. Die Goldnachfrage Chinas stieg 2013 um 32% auf 1.066 Tonnen, die Indiens um 13% auf 975 Tonnen. Damit hat China Indien als weltgrößtes Konsumentenland abgelöst.
http://goldseiten.de/artikel/200602--Gold-mit-ueberraschend-starkem-Jahresauftakt.html?seite=2
 
20.03.2014 07:05 | Vertrauliche Mitteilungen
Frankreich gründet staatliches Bergbauunternehmen

Frankreichs Regierung erwägt die Gründung einer staatlichen Bergbaugesellschaft, um den möglichst direkten Zugriff des Staates auf begehrte Industrierohstoffe zu gewährleisten. In den nächsten fünf bis sie ben Jahren sollen dazu bis zu 400 Mio. € Steuergelder aufgewendet werden, sagte Industrieminister Arnaud Montebourg gegenüber der Zeitung "Le Parisien".

Das Vorhaben soll auch gegen die Frankreich zur Zeit beherrschende Wirtschaftskrise helfen, zu deren Bekämpfung der sozialistische Minister bis vor kurzem noch eine "Abwertung" des Euro forderte. Mit der Gründung eines neuen und sehr großen Staats konzerns richtet sich Paris darüber hinaus in aller Deutlichkeit gegen den in den meisten anderen Euro-Ländern herrschenden Trend, mit der Veräußerung bisher staatlicher Unternehmen zur Schuldenverringerung beizutragen.

Die neue "Compagnie Nationale des Mines de France" (CMF) soll im In- und Ausland Bodenschätze erschließen und ausbeuten. Neben klassischen Bodenschätzen wie Gold, Diamanten und Uran soll die Erschließung zunächst insbesondere der Förderung von Lithium und Germanium dienen, die Frankreichs Industrie für die Herstellung von Batterien und Glasfaserkabeln dringend benötigt. Beträchtliche Goldreserven erhofft man sich in Paris darüber hinaus im Überseegebiet Französisch-Guayana in Süd amerika.

Doch auch "in den frankophonen Ländern in Afrika" würde man laut Montebourg lieber mit einem staatlichen französischen Konzern zusammen arbeiten als mit "multinationalen Konzernen aus dem Aus land". Nicht zu vergessen ist in diesem Zusammenhang aber auch, was Montebourg wohl lieber verschwieg: Kann es ein Zufall sein, daß französische Truppen gerade jetzt verstärkt in Mali und Zentral afrika eingesetzt werden, wo erhebliche Vorräte an Diamanten, Gold und Uran vermutet werden...?

In diesem Zusammenhang interessant ist auch eine kürzlich von der Weltbank veröffentlichte "Bodenschatz karte" Afrikas, die Bergbau-Unternehmen und Politik gleichermaßen die Planung der Rohstoff ausbeute erleichtern soll. Die auf der Karte noch verbliebenen "weißen Flecke" sollen nun mit Infrarot-Kameras und moderner Satellitentechnik untersucht werden, um auch noch die "letzten" Vorkommen ausweisen zu können © Vertrauliche Mitteilungen
 
20.03.2014 09:00 | Redaktion
Dennis Gartman: Wie geht es weiter mit dem Goldpreis?

Der Rückgang, den Gold in den letzten Tagen erfahren musste, ist nach Ansicht Dennis Gartmans nur eine Korrektur in einem echten Bullenmarkt, wie sich der Verfasser und Herausgeber des Gartman Letter im Interview mit Jackie DeAngelis von CNBC überzeugt zeigt.

Damit der Goldpreis von hier an in die Höhe schnellt, müsste sich die Situation auf der Halbinsel Krim erneut verschlechtern oder die Fed müsste sich offenkundig dafür entscheiden, das Tempo der Reduzierung ihrer Anleihekäufe zu drosseln. Auch steigende Preise bei Öl und anderen Rohstoffen könnten Gold deutlichen Auftrieb geben.

Hiervon trifft aktuell jedoch nichts zu, sodass ein rapider Anstieg des Goldpreises nicht zu erwarten sei, so Gartman. Und doch rechnet der Experte mit einem - wenn auch ruhiger - steigenden Preis des Edelmetalls, denn im Hinblick auf die Stimmung am Goldmarkt wie auch aus technischer Sicht spreche alles für das gelbe Metall. Vielversprechend für den Rest des Jahres sei nach Ansicht Gartmans dabei der Kauf sowohl von Gold als auch von US-Aktien. © Redaktion GoldSeiten.de
 
20.03.2014 09:33 | Hannes Huster
FED-Sitzung sorgt für schwache Märkte

Gestern fand die Pressekonferenz nach dem FOMC Treffen der US-Notenbank FED statt. Es wurde beschlossen, dass die monatlichen Anleihekäufe auf 55 Milliarden USD (-10 Milliarden USD) gesenkt werden und die Zinsen unverändert zwischen 0,00% und 0,25% bleiben.

Die wichtigsten Punkte neben diesen Entscheidungen waren aus unserer Sicht, dass die FED, die noch von Bernanke festgelegte Marke von 6,50% bei der Arbeitslosenquote, nicht mehr als Zielmarke ansieht. Yellen betonte, dass der Arbeitsmarkt nicht nur an dieser Zahl analysiert werden kann und es tieferliegende Probleme gibt, die die FED dazu veranlasst, die Zinsen auch bei einer Arbeitslosenquote von unter 6,50% niedrig zu halten. Sie verwies vor allem auf die vielen Teilzeitstellen, die hohen Kündigungsraten, die viel zu niedrigen Lohnsteigerungen und die hohe Langzeitarbeitslosigkeit.

Es seien Spätfolgen der Finanzkrise, die der Arbeitsmarkt zu spüren bekommt und auch die Einsparungen beim Staat, die den Arbeitsmarkt, aber auch die wirtschaftliche Erholung bremsen.

Weiterhin bereitet die zu niedrige Inflation Kopfschmerzen. Dieses Thema wurde mehrfach angesprochen, auch bei der anschließenden Fragerunde der Journalisten. Yellen sieht die niedrige Inflation als Problem an und würde eingreifen, wenn diese die Wirtschaftserholung negativ beeinflusst oder in absehbarer Zeit keine Chance besteht, dass die Inflation in Richtung der 2% Marke steigt. Die FED geht von einer leicht steigenden Inflation in 2014 aus und sieht erste in 2015 eine Rückkehr auf 2%. Warum und wie, konnte Yellen aber nicht beantworten.

Die Zinsen sollen weiterhin niedrig bleiben und für die Reduzierungen der Anleihekäufe gibt es keinen festen Fahrplan.

Wichtig war aus unserer Sicht noch die Aussage, dass die FED die Zinsen selbst dann niedrig halten wird, wenn das Ziel der Vollbeschäftigung (Arbeitslosenrate < 5%) erreicht ist und die Inflation auf 2% steigt. Je weiter eine dieser Größen von den Zielen entfernt liegt, desto länger wird die FED die Zinsen am Boden halten.

Yellen irritierte die Märkte leicht, als ein Journalist nach dem Zeitraum für eine mögliche Zinserhöhung fragte. Sie antwortet zunächst mit "etwa 6 Monaten" korrigierte dies aber später mit "etwa 6 Monate nachdem die Anleihekäufe beendet wurden".

Wir haben uns gestern die ganze Sitzung "angetan" und interpretieren die Aussagen folgendermaßen. Die Wirtschaftserholung steht auf einem schwachen Fundament, der Arbeitsmarkt ist weit davon entfernt gesund zu sein und die niedrige Inflation ist ein Problem. Die Zinsen werden frühestens in 18 Monaten erhöht, aber auch nur dann, wenn die Inflation auf 2% oder darüber liegt.

Der US-Dollar zog an und beendete die längere Abwärtsbewegung zunächst:

gs532aa7e379ba6.png


Fazit:

Yellen hat mit einigen verwirrenden Aussagen für Verunsicherung gesorgt. Auch die Markteilnehmer waren sich nicht einig, wohin sie nun kurzfristig wandern sollen. Die Aktien gaben nach, Gold gab nach und auch die Anleihen gaben nach. Nur der US-Dollar zog leicht an.

Wir glauben, dass die FED keinerlei Richtungsänderung vornehmen wird und die Märkte dies heute oder morgen auch widerspiegeln werden. © Hannes Huster
 
Gold ETF’s ‘perfect bullish’ chart? Other analysts say let’s not overdo it
March 19, 2014, 12:59 PM

MW-BW961_gld_MG_20140319012334.jpg


After last year’s drubbing, gold has recovered somewhat in 2014.

But does the main gold ETF have a “perfect bullish chart,” as one analyst puts it?

Well, some other gold watchers also sound upbeat, but they basically say let’s not overdo the enthusiasm.

The “perfect” and “screaming” bullish view comes from the “Read the Ticker” blog, and it was the chart of the day in MarketWatch’s Need To Know column on Wednesday. According to that analysis, which features the chart above, 200 could be the next level for the SPDR Gold Trust GLD . GLD was trading around 129 on Wednesday, while April gold GCJ4 was last around $1,342 an ounce.

“I do wonder if they are permabulls on gold,” said Ryan Detrick of Schaeffer’s Investment Research, when asked about the analysis. “You can’t just stick to any one view,” he said in an email to MarketWatch.

Detrick added that he does “like the idea that the gold rally is still in play though.” His firm was bearish on gold last year, but currently expects more gains in 2014.

Positives for GLD include the ETF breaking above its 200-day moving average last month and a 50-day moving average that’s pointing higher, according to Detrick, a senior technical strategist at Schaeffer’s. He also points to “a nice double bottom near $115” and sentiment not at “what you’d see at a major peak,” saying the pullback over the last week is just a normal correction after a strong run.

MW-BX022_gld_sp_MG_20140319124519.jpg


Looking at April gold, Jim Wyckoff at Kitco.com also offers an optimistic take with some caveats.

Gold bulls “have the overall near-term technical advantage, but need to step up and show some fresh power soon,” said Wyckoff, a senior analyst at Kitco, in emailed comments on Wednesday. Bulls need to produce a “close above technical resistance at this week’s high of $1,392.60,” he said.

On the bearish side, some analysts have said this year’s advance is merely a counter-trend rally in a long-term slide, and GLD could fall back as the Fed keeps tapering, according to a recent IBD article.

Speaking of the Fed, gold was down intraday Wednesday as traders waited for Janet Yellen‘s first news conference as Fed chairwoman. Her analysis of gold prices has drawn better reviews than Ben Bernanke’s take. – Victor Reklaitis
 
Silver pulls back from 3 year trend-line, yet support awaits
March 19, 2014 by Joshua Mahony in Technical analysis

The price of silver has been recovering in recent weeks, following on from the strong upside seen in it’s big brother gold which has been strengthening throughout 2014. The existence of a historical trend-line provides substantial resistance to the upside. Yet with strong support to the downside, there is likely to be a highly notable move in the coming days.

The weekly chart shows that over the long term, the primary trend is to the downside, having pulled back from a high of $49.70 in 2011 to $20.80 today. However, with the red descending trend-line in existence, this protracted downturn could come into question with an upside break. This would be consistent with the recovery seen in gold over the past months. Of course, the break above the 50 week simple moving average, red descending trend-line and upper bollinger band would be highly notable as a potential sign that the pair could be moving into a more bullish phase. However, with the stochastic oscillator pointing towards a more bearish outlook, the middle bollinger (20 week SMA) and 20.425 support level could come into question beforehand.

timthumb.php


On the daily time-frame, the combination of the 50 day SMA, 100 day SMA, lower bollinger band along with historical highs and lows are likely to provide substantial support to any downside price action in the near term. This means that we are likely to see the shaded area as being key to the future direction of the commodity. Should we break and close to the upside, then I would be looking for a more substantial push higher where resistance comes in at 22.15, 23.0 and 25.096. Meanwhile a break to the downside would be somewhat less dramatic and would likely mean a return to the range trading we saw in December and January between 18.97 and 20.425.

timthumb.php
 
GOLD UND ROHÖL
Gold: Statements von Fed-Chefin Yellen belasten


An den Goldmärkten reagierten die Marktakteure enttäuscht auf die gestrigen Statements von Fed-Chefin Janet Yellen. Im Tief sank der Goldpreis auf 1.326,10 Dollar.

von Jörg Bernhard

Die erneute Kürzung der monatlichen Staatsanleihekäufe um 10 Milliarden auf nunmehr 55 Milliarden Dollar war zwar erwartet worden, die relativ positive Bewertung der wirtschaftlichen Perspektiven und die Prognose steigender Zinsen für 2015 belasteten allerdings das gelbe Edelmetall spürbar. Die nach den Fed-News einsetzende Dollarstärke tat ein Übriges, die Attraktivität des Goldpreises einzudämmen. An den Goldmärkten wird nun mit einem Auslaufen der Anleihekäufe im Herbst gerechnet. Ein wichtiges Argument für Gold, die massive Flutung der Märkte mit Liquidität, verliert somit an Strahlkraft. Das Problem der exorbitanten Staatsverschuldung wird dadurch allerdings keineswegs gelöst. Nur zur Erinnerung: Seit dem Ende des Bretton-Woods-Abkommens verdoppelt sich innerhalb von zehn Jahren der Schuldenberg in den USA. Vor diesem Hintergrund macht es durchaus Sinn, auch weiterhin einen Teil des Vermögens in Gold zu investieren.
Am Donnerstagvormittag präsentierte sich der Goldpreis mit nachgebenden Notierungen. Bis gegen 8.00 Uhr (MEZ) ermäßigte sich der am aktivsten gehandelte Future auf Gold (April) um 10,00 auf 1.331,30 Dollar pro Feinunze.

Rohöl: Fed-Statements gut verdaut

Janet Yellen gab dem Winter die Schuld an der verhaltenen Entwicklung der US-Wirtschaft und wurde somit eher als Optimistin wahrgenommen. Am Nachmittag stehen diesbezüglich gleich drei wichtige Konjunkturindikatoren zur Bekanntgabe an. Neben den wöchentlichen Erstanträgen auf Arbeitslosenhilfe wird auch der Konjunkturausblick der Philadelphia Fed sowie die Februarverkäufe existierender Wohnbauten veröffentlicht.
Am Donnerstagvormittag präsentierte sich der Ölpreis mit erholten Notierungen. Bis gegen 8.00 Uhr (MEZ) verteuerte sich der nächstfällige WTI-Kontrakt (April) um 0,38 auf 100,75 Dollar, während sein Pendant auf Brent (Mai) um 0,19 auf 106,04 Dollar anzog.
 
TROTZ FED-ENTSCHEIDUNG
Ölpreise gestiegen


Die Ölpreise sind am Donnerstag im asiatischen Handel gestiegen.

Ein Barrel (159 Liter) der Nordseesorte Brent zur Lieferung im Mai kostete zuletzt 106,18 US-Dollar. Das waren 33 Cent mehr als am Vortag. Der Preis für ein Fass der amerikanischen Ölsorte WTI zur Auslieferung im April stieg um 38 Cent auf 100,75 Dollar.

Die laut Zahlen vom Mittwoch gestiegenen Rohöllagerbestände in den USA hatten die Ölpreise nur vorübergehend belastet. Auch die geldpolitische Entscheidung der US-Notenbank wirkten sich kaum auf die Ölpreise aus. Die Erhöhung der Leitzinsprognosen der Fed-Mitglieder spreche für eine frühere Zinserhöhung, sagten Analysten. Belastet wurden die Ölpreise dadurch allerdings nicht./jsl/stb
 
GOLD UND ROHÖL
Goldpreis: Charttechnisch angeschlagen


Die von der US-Notenbank Fed kommunizierte Aussicht auf steigende Zinsen ließ das gelbe Edelmetall auf den tiefsten Stand seit drei Wochen fallen.

von Jörg Bernhard

Steigende Zinsen verursachen bei Gold höhere Opportunitätskosten. Erfahrungsgemäß sinkt dadurch das Edelmetall in der Gunst der Anleger, weil Goldbesitzer auf höhere Zinseinnahmen verzichten müssen und bei sicherer Verwahrung sogar zusätzliche Kosten entstehen. Die Bonität einer Staatsanleihe bleibt angesichts der Staatsschuldenkrise auch bei höheren Zinsen fraglich. Allgemein galt in der Vergangenheit stets die Regel, dass sich höhere Zinsen auch als Indiz für ein höheres Ausfallrisiko interpretieren lassen. Während bei jeder Anleihe - zumindest aus theoretischer Sicht - ein Totalverlust möglich ist und in der Vergangenheit auch immer wieder vorkam, blieb dem Goldpreis ein solches Schicksal dank seines Sachwertcharakters bislang erspart. Aus charttechnischer Sicht hat sich die Lage nun aber erheblich eingetrübt. So versucht das Edelmetall, derzeit die bei 1.325 Dollar verlaufende Unterstützungszone zu verteidigen. Richtig spannend wird es aber im Bereich von 1.300 Dollar. Zum einen wegen der dort verlaufenden 200-Tage-Linie und zum anderen aus psychologischer Sicht.
Am Donnerstagnachmittag präsentierte sich der Goldpreis mit fallenden Notierungen. Bis gegen 14.30 Uhr (MEZ) ermäßigte sich der am aktivsten gehandelte Future auf Gold (April) um 15,10 auf 1.326,20 Dollar pro Feinunze.

Rohöl: US-Arbeitsmarkt einen Tick besser

Die wöchentlichen Neuanträge auf Arbeitslosenhilfe fielen etwas besser als erwartet aus. Mit 320.000 unterschritt die Zahl neuer Arbeitsloser den Erwartungswert einer Bloomberg-Umfrage unter Analysten um 5.000. Um 15.00 Uhr dürften sich die Akteure an den Energiemärkten für zwei andere wichtige US-Konjunkturindikatoren interessieren: die Februarverkäufe existierender Wohnbauten sowie der Konjunkturausblick der Philadelphia Fed. Letzterer soll sich im März von minus 6,3 auf plus 3,0 Prozent verbessert haben.
Am Donnerstagnachmittag präsentierte sich der Ölpreis mit nachgebenden Notierungen. Bis gegen 14.30 Uhr (MEZ) ermäßigte sich der nächstfällige WTI-Kontrakt (April) um 0,52 auf 99,85 Dollar, während sein Pendant auf Brent (Mai) um 0,21 auf 105,64 Dollar zurückfiel.
 
Two Palladium ETFs To Launch In South Africa Next Week
By Allen Sykora of Kitco News
Thursday March 20, 2014 2:35 PM

Editor's Note: Updating earlier story with additional details, comments.

(Kitco News) - It turns out that not one but two palladium exchange-traded funds will be launched in South Africa next week.

The corporate and investment banking division of Absa Bank Ltd., member of Barclays, Thursday said it will list its palladium-backed ETF, NewPalladium, on the Johannesburg Stock Exchange on March 27.

The market has long been awaiting news on the pending start ever since demand for a similar Absa platinum ETF launched last year quickly drew strong investor interest. It became the world’s largest physically backed platinum ETF within months.

The announcement about the coming Absa palladium ETF launch comes just one day after news that Standard Bank of South Africa is preparing to list the country’s first palladium-backed ETF on the Johannesburg Stock Exchange on Monday.

NewPalladium will join other Absa commodity ETFs that include NewGold, the largest ETF in Africa, and NewPlat. An investment in NewPalladium, issued by NewGold Issuer Ltd., will provide investors with the opportunity to obtain exposure to the South African rand performance of bullion.

“Our product will have full liquidity from Day 1,” Vladimir Nedeljkovic, head of exchange-traded products at the corporate and investment banking division of Absa, told Kitco News. “We will be able to satisfy any investor need from Day 1 because we already have supply of South African palladium that we managed to source….”

Standard plans to also launch gold and platinum ETFs in the near future. The company’s palladium ETF is called AfricaPalladium. Plans call for the AfricaGold and AfricaPlatinum ETFs to be listed in early April.

Absa’s platinum ETF, started last April, is approaching holdings of 1 million ounces, Nedeljkovic said. Holdings have continued to rise since the start of the year, he added.

It’s hard to forecast just how much investment interest there will be in the new palladium ETF, Nedeljkovic said, but “we think there is going to be good demand among institutions for this product.”

Demand for the current Absa platinum ETF rose so dramatically last year in part because the country is the world’s largest producer of the metal, therefore South African institutional investors were already familiar with the commodity, Nedeljkovic said. South Africa provides some three-quarters of the world’s mined platinum supply. It is generally regarded the second-largest palladium producer behind Russia.

“Most of our institutional investors have had quite large exposure to the mining sector and to the platinum miners. So they know quite a lot about the sector,” Nedeljkovic said.

Further, he said, many in the country might look to platinum as a “country hedge” type of investment. For instance, if there are any major crises in the country, such as the current strike in the platinum-mining sector, this should in theory underpin the platinum price due to less global supplies.

“So having a platinum investment is a good defensive investment in a South African context,” he said.

On top of this, many analysts around the world already look for improvement in platinum prices. Bank of America Merrill Lynch on Thursday forecast an average 2014 price of $1,554 an ounce, which is above the Thursday pit settlement of $1,434.80 for the most-active April contract on the New York Mercantile Exchange. Commerzbank said on Wednesday that it sees platinum rising to a fourth-quarter average of $1,600.

BAML looks for palladium to average $792 this year; Nymex June palladium settled at $771.65. Commerzbank forecast a fourth-quarter average of $825.
 
P.M. Kitco Metals Roundup: Gold Ends Steady-Lower But Sellers May Be Exhausted for Now

Thursday March 20, 2014 1:41 PM

(Kitco News) - Comex gold prices ended the U.S. day session lower and hit a three-week Thursday. The spot gold market finished near steady. However, both prices did finish nearer their daily highs as some bargain hunters stepped in to buy the dip and some short covering surfaced in gold futures. This could be an early clue the sellers have become exhausted from their recent assault on prices. A solid rally in the U.S. dollar index the past 24 hours and the FOMC news from Wednesday pressured the precious metals markets again Thursday. April gold was last down $11.50 at $1,329.80 an ounce. Spot gold was last quoted down $0.70 at $1,330.50. May Comex silver last traded down $0.426 at $20.40 an ounce.

The market place on Thursday further digested the statement of the latest U.S. Federal Reserve Open Market Committee (FOMC) meeting that ended Wednesday afternoon, and Fed Chair Janet Yellen’s press conference afterward. As expected, the FOMC will continue on its “tapering” program, whereby monthly bond purchases are whittled down by $10 billion a month. What rattled some markets, including gold, was an indication the Fed could begin to raise U.S. interest rates sooner than many expect—sometime in 2015. Yellen is perceived to be fully in the dovish camp on monetary policy, and several markets were caught off guard by the FOMC statement and her remarks that were deemed less-than-fully-dovish.

The U.S. dollar index surged following the FOMC developments, which in turn has been a bearish underlying factor for commodity markets, including gold. U.S. Treasury market prices have also slumped (yields rising).

The Ukraine-Russia matter has moved from an international crisis to a regional squabble, from the perspective of the market place. Gold is no longer drawing a safe-haven bid from this situation. A report from NBC News did say Russian troops were again massing on the Russia-Ukraine border, but as of this writing the markets were not paying much attention. German President Angela Merkel on Thursday called the Group of Eight (G-8) nations defunct—basically kicking Russia out of the club of the eight most economically powerful nations in the world. Any significant escalation of tensions between Ukraine and Russia would quickly put keen risk-aversion back into the market place.

U.S. economic data released Thursday included the weekly jobless claims report, existing home sales, leading economic indicators, and the Philadelphia Fed business survey. The data was mixed but did favor stronger readings, which supported the greenback and U.S. stock market, and in turn was a negative for the gold market.

The London P.M. gold fixing was $1,327.00 versus the previous P.M. fixing of $1,338.00.

Technically, April gold futures prices closed nearer the session high after hitting a fresh four-week low early on. Near-term chart damage has been inflicted this week as a 2.5-month-old uptrend on the daily bar chart was negated. Bulls and bears are now on a level near-term technical playing field. The gold bulls’ next upside near-term price breakout objective is to produce a close above solid technical resistance at $1,360.00. Bears' next near-term downside breakout price objective is closing prices below solid technical support at $1,300.00. First resistance is seen at Thursday’s high of $1,335.30 and then at $1,340.00. First support is seen at Thursday’s low of $1,320.80 and then at $1,310.00. Wyckoff’s Market Rating: 5.0

May silver futures prices closed near mid-range Thursday after hitting a fresh six-week low early on. Prices are in a four-week-old downtrend on the daily bar chart. The bears have the near-term technical advantage and have gained downside momentum this week. Silver bulls’ next upside price breakout objective is closing prices above solid technical resistance at last week’s high of $21.795 an ounce. The next downside price breakout objective for the bears is closing prices below solid technical support at $20.00. First resistance is seen at Thursday’s high of $20.73 and then at $21.00. Next support is seen at Thursday’s low of $20.14 and then at $20.00. Wyckoff's Market Rating: 3.5.

May N.Y. copper closed down 490 points at 293.80 cents Thursday. Prices closed nearer the session low. There was not follow-through buying today and a bullish “key reversal” up on the daily bar chart was not confirmed. Prices are in an 11-week-old downtrend on the daily bar chart. Bears have the solid near-term technical advantage. Copper bulls' next upside breakout objective is pushing and closing prices above solid technical resistance at last week’s high of 307.75 cents. The next downside price breakout objective for the bears is closing prices below solid technical support at this week’s low of 287.70 cents. First resistance is seen at 295.00 cents and then at 297.50 cents. First support is seen at 290.00 cents and then at 287.70 cents. Wyckoff's Market Rating: 1.0.
 
Barclays: Swiss Data Show No Spike In Russian Palladium Shipments

Thursday March 20, 2014 11:18 AM

Russian shipments of palladium to Switzerland were largely stable in February and the trend is likely to remain lower, says Barclays. Traders closely monitor Swiss trade data for signs of Russian supplies, as Russia is thought to move much of its palladium through Switzerland. Russian shipments in February were roughly 6,500 ounces, Barclays says. Barclays says this was “nearly identical to January – which has been the trend for more than a year. Similar to previous months, the base trend of shipments was entirely semi-manufactured, whereas spikes in previous months came in the form of powder. Ignoring the spikes in 2013, shipments have trended lower as the 6.4-6.6koz median shipment has occurred in more of half of the months since the beginning of 2011.” Barclays says it expects the overall trend lower in shipments to continue, but with the risk of a spike yet in the first quarter. “Overall, we continue to expect limited releases from Russian state stocks this year and reiterate our expectation for the palladium market to deliver a sizable deficit in 2014. “

http://www.kitco.com/news/2014-03-20/KitcoNewsMarketNuggets-March-20.html
 
A.M. Kitco Metals Roundup: Gold Rebounds On Short Covering, Bargain Hunting, Technical Bounce

Friday March 21, 2014 7:56 AM

(Kitco News) - Gold prices are moderately higher in early trading Friday, on short covering and a technical correction following this week’s strong losses. Some bargain hunters have also stepped in to “buy the dip.” April gold was last up $10.20 at $1,340.70 an ounce. Spot gold was last quoted up $12.60 at $1,341.40. May Comex silver last traded up $0.115 at $20.545 an ounce.

The Ukraine-Russia conflict has not completely disappeared from the radar screen of the market place. Tensions have risen a bit Friday as the U.S. on Thursday slapped stiffer economic sanctions on Russia. The European Union is set to follow suit with its own sanctions against Russia. And Russia, in turn, is sanctioning the U.S. and EU. Gold, the U.S. dollar and U.S. Treasuries are not presently drawing significant safe-haven bids from this situation. However, any significant escalation of tensions between Ukraine and Russia would quickly put keen risk-aversion back into the market place and would likely benefit safe-haven gold.

The Russian stock and financial markets are feeling the bearish effects of world sanctions and from credit ratings agencies that have or are looking to downgrade Russia’s credit rating.

There is no major U.S. economic data due for release Friday. Traders are looking ahead to some fresh Chinese economic data due out early next week.

A feature in the market place this week has been the plunge in the value of the Chinese yuan against the U.S. dollar, after China’s monetary officials widened the trading band between the two currencies. The yuan has dropped to a more-than-one-year low against the greenback this week.

Meantime, the U.S. dollar index surged Wednesday and Thursday following the FOMC news Wednesday afternoon, which in turn has been a bearish underlying factor for commodity markets, including gold. The dollar index was slightly lower Friday morning.
The dollar index is a basket of six major currencies weighted against the greenback.

Wyckoff’s Daily Risk Rating: 5.0 (The Ukraine situation has for the moment de-escalated and has become a non-factor.)

(Wyckoff’s Daily Risk Rating is your way to quickly gauge investor risk appetite in the world market place each day. Each day I assess the “risk-on” or “risk-off” trader mentality in the market place with a numerical reading of 1 to 10, with 1 being least risk-averse (most risk-on) and 10 being the most risk-averse (risk-off), and 5 being neutral.

The London A.M. gold fix is $1,338.50 versus the P.M. fixing of $1,327.00.

Technically, April gold futures have this week seen a 2.5-month-old uptrend on the daily bar chart at least temporarily negated. The gold bulls and bears are now back on a level near-term technical playing field. Bulls’ next upside near-term price breakout objective is to produce a close above technical resistance at $1,360.00. Bears' next near-term downside breakout price objective is closing prices below technical support at $1,300.00. First resistance is seen at the overnight high of $1,343.00 and then at $1,350.00. First support is seen at the overnight low of $1,328.00 and then at this week’s low of $1,320.80.

May silver futures are seeing some short covering Friday morning, too, after hitting a six-week low on Thursday. The bears have the near-term technical advantage. A four-week-old downtrend is in place on the daily bar chart. Silver bulls’ next upside price breakout objective is closing prices above solid technical resistance at $21.50 an ounce. The next downside price breakout objective for the bears is closing prices below solid technical support at $20.00. First resistance is seen at Thursday’s high of $20.73 and then at $21.00. Next support is seen at the overnight low of $20.285 and then at this week’s low of $20.14.
 
BMO: 575,000 Oz Of Platinum Lost So Far In South African Strike

Friday March 21, 2014 8:34 AM

A strike against leading South African producers of platinum group metals has resulted in lost platinum output of some 575,000 ounces so far, says BMO Research. The strike began in January. Further, BMO points out, whenever the strike ends, it will take time to regain full operations. “Thus far, the producers have been meeting their sales commitments by drawing down on material in inventory,” the firm says. However, BMO Research estimates “that with inventories now likely close to being depleted, PGM supply to the market could be reduced going forward, potentially leading to a tighter market and an increase in PGM prices.”

http://www.kitco.com/news/2014-03-21/KitcoNewsMarketNuggets-March-21.html
 
The Ugly Cousins; Grey And Misunderstood

Friday March 21, 2014 08:34

Yesterday we suggested that traders may cover their shorts, after the heavy selling that occurred after the Crimea vote became clear on Monday. With President Obama again pushing for more sanctions against Russia, traders took the better ‘safe than sorry’ approach and we find gold, at time of writing, up some $20 from yesterday’s open. Silver also regained some loft, up some 2% from yesterday’s open.

The big story is the PGMs. We have been “very” constructive regarding the platinum group metals on basis supply/demand fundamentals. Both metals were projected to be in supply shortage, by late 2014, “ before”, the South African strike and “before” any potential supply disruptions from Russia. Yesterday, Kitco News reported that Standard Bank and ABSA Bank of South Africa will both be launching a palladium ETF and Standard was also planning a Platinum ETF launch in the near future. This, coming in a market with unreliable supply and one that already expects an inventory deficit. Palladium soared $30 overnight, touching $800. North Americans have never really taken the time to understand the PGMs, but this group is exchange traded, is available in small investment size bars and coins and to give perspective, when gold started its lift from the $800 level in 2008, (I have told you the rhodium story, then at $10,000), platinum traded at a $1,300 premium to gold. When talking heads suggest a percentage of your portfolio should be in precious metals (i.e. hard assets), the position doesn’t exclude the PGMs. Platinum and palladium may not be as pretty or shiny as gold, but when they lift, they are much more fun to take to the dance.
 
Where are the Stops? Friday, March 21: Gold and Silver

Friday March 21, 2014 08:29

Below are today's likely price locations of buy and sell stop orders for the active Comex gold and silver futures markets. The asterisks (**) denote the most critical stop order placement level of the day (or likely where the heaviest concentration of stop orders are placed on this day).

See below a detailed explanation of stop orders and why knowing, beforehand, where they are likely located can be beneficial to a trader.

April Gold Buy Stops Sell Stops
$1,325.00 $1,320.00
$1,335.30 $1,310.00
$1,340.00 **$1,300.00
**$1,350.00 $1,290.00
May Silver Buy Stops Sell Stops
$20.73 $20.285
**$21.00 $20.14
$21.25 **$20.00
$21.50 $19.75
 
Palladium Reaches Highest Since 2011 on Russia Sanctions
By Debarati Roy Mar 21, 2014 4:47 PM GMT+0100
-
Palladium rose to the highest since August 2011 on concern that sanctions will trim supplies from Russia, the world’s biggest supplier of the metal used in pollution-control devices for cars.

The U.S. and the European Union have extended the list of prominent Russians subject to sanctions as President Vladimir Putin completed its annexation of Crimea. The supply threat comes as miners haven’t backed back down from a strike that started in January in South Africa, the second-biggest palladium producer. The nations accounted for almost 80 percent of global output last year, London-based Johnson Matthey Plc estimates.

The political restrictions and labor unrest are adding to a tightening supply outlook as demand is set to top production by 783,000 ounces this year, according to Barclays Plc. Concerns that the hostility in Crimea will disrupt raw-materials shipments have boosted prices of commodities from corn to crude oil. Palladium has rallied almost 10 percent this year, the best start to a year since 2010.

“Economic sanctions will cripple supplies, and people are getting very concerned about that,” Mike Dragosits, a senior commodity strategist at TD Securities in Toronto, said in a telephone interview. “The sanctions may only intensify since Putin shows no signs of stepping down.” TD sees the deficit at 1.29 million ounces this year, he said.

Reaching $800

On the New York Mercantile Exchange, palladium futures for June delivery gained 2.3 percent to $789.10 an ounce, heading for the biggest advance since Oct. 17. Earlier, prices reached $800, the highest since Aug. 3, 2011.

Trading was more than 90 percent above the 100-day average for this time of day, data compiled by Bloomberg showed.

Absa Bank Ltd., a unit of Barclays, will list NewPalladium, an exchange-traded fund, in Johannesburg on March 27, the company said in a statement yesterday. All the metal backing the ETF will be sourced from South Africa, making consumers “even more dependent” on Russian supplies, Commerzbank AG said in a report today.

“The new ETF shows there is so much demand in the market, and the supplies could be strained further,”Dragosit said.

Holdings in global palladium ETPs rose 0.7 percent this month to 65.45 metric tons.

Platinum futures for April delivery rose 0.2 percent to $1,437.80 an ounce on the Nymex, heading for the first increase this week.
 
Gold Futures Rise to Snap Longest Slump in Four Months
By Debarati Roy Mar 21, 2014 5:00 PM GMT+0100

Gold futures rose, snapping the longest slump in four months, as the dispute between Russia and the West over Ukraine escalated, increasing demand for a haven.

Russia completed its annexation of Crimea as the European Union signed a political accord with Ukraine, and President Barack Obama yesterday expanded U.S. financial sanctions against Russian officials and businessmen. Gold dropped in the previous four days, partly on Federal Reserve Chair Janet Yellen’s forecast for rising U.S. interest rates.

“There is some safe-haven buying,” Phil Streible, a senior commodity broker at R.J. O’Brien & Associates in Chicago, said in a telephone interview. “Today’s move maybe temporary as the sentiment has turned negative because of the rate-hike surprise.”

Gold futures for June delivery rose 0.4 percent to $1,336.50 an ounce at 11:58 a.m. on the Comex in New York. Through yesterday, the price climbed 11 percent this year.

The metal dropped 3.5 percent in the past four days. Yellen said on March 19 that U.S. rates may rise around six months after asset purchases end, expected later this year.

On March 17, gold reached a six-month high of $1,392.60 amid faltering U.S. economic growth and escalating tensions in Ukraine.

Goldman Outlook

The rally was based on “transient” factors including a slowdown in the U.S. economy because of cold weather, China credit concerns and geopolitical tensions, Jeffrey Currie, Goldman Sachs Group Inc.’s head of commodities research, said in a report.

“While further escalation in tensions could support prices, we expect acceleration in U.S. growth will bring gold prices lower,” he said.

In 2013, gold tumbled 28 percent, the most since 1981, as some investors lost faith in the metal as a store of value amid a U.S. equity rally to a record and muted inflation.

The Fed this week reduced monthly asset purchases by $10 billion to $55 billion and said bond buying will be tapered in measured steps.

Gold surged 70 percent from December 2008 to June 2011 as the Fed pumped more than $2 trillion into the financial system and cut interest rates to boost the economy.

Silver futures for May delivery fell 0.3 percent to $20.37 an ounce. The price headed for the biggest weekly drop since mid-September. The metal, which has broader industrial applications than gold, declined for the fifth straight session, the longest slump in four months.

Yesterday, a gauge of six industrial metals including copper and aluminum fell to the lowest in almost nine months.
 
Status
Für weitere Antworten geschlossen.
Oben Unten